By Suzanne R. Mellen
Following a year of robust transaction activity, hotel capitalization rates remain stable, while hotel NOI and values are under pressure due to slowing RevPAR growth and increasing operating expenses. This article looks at hotel sales and capitalization rate trends, the impact of slowing RevPAR growth on hotel values, and the outlook for 2019. [1]
With a more business-friendly administration in place and the passage of the Tax Cut and Job Act (TCJA) in December 2017, the outlook for the economy and hotel performance became brighter in 2018. Hotels generate higher returns than other commercial real estate and reflect changes in economic conditions overnight, positive attributes in an “up” market for investors chasing yield.
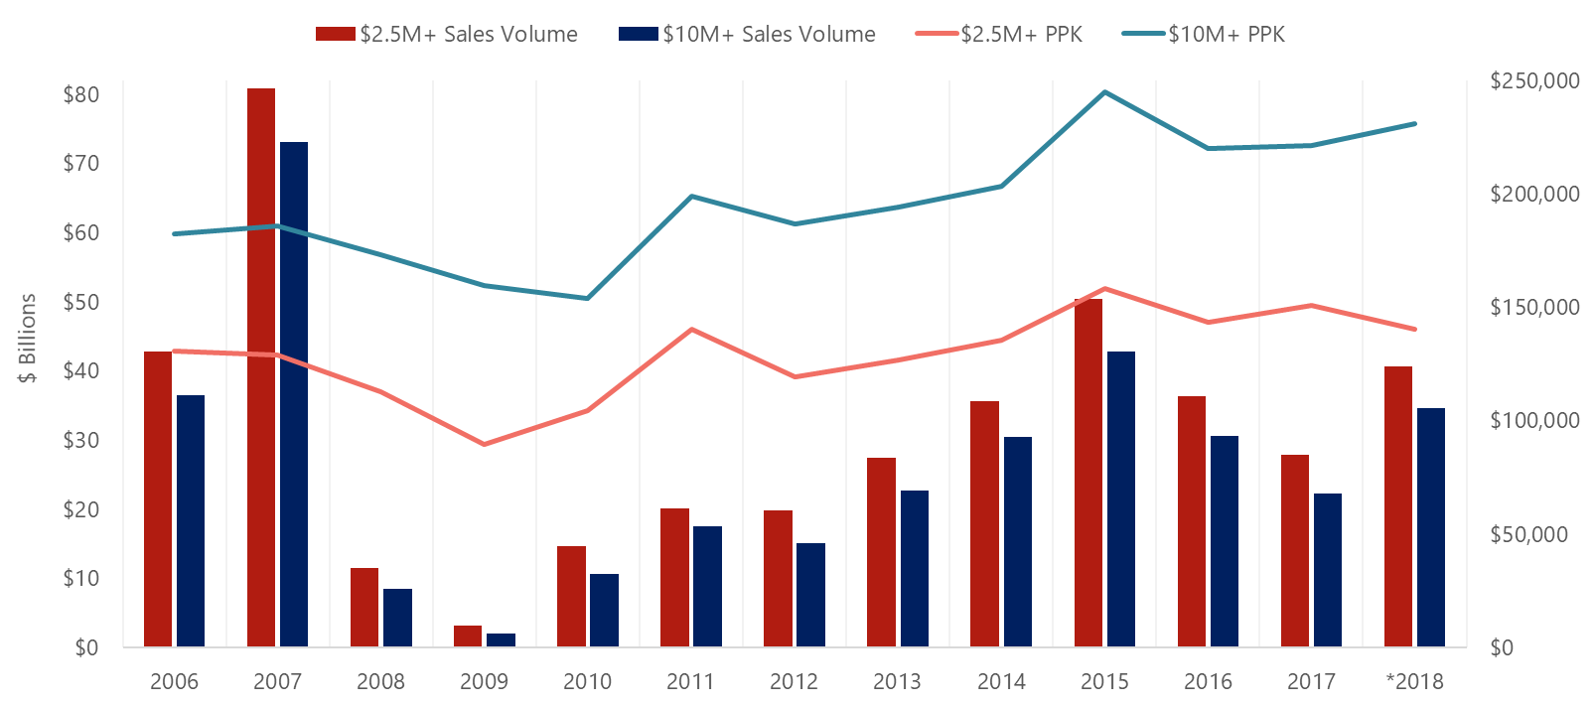
Hotel owners and investors took advantage of the market’s optimism, with 2018 turning out to be a robust year of transaction activity. The lodging sector attracted greater interest from investors looking for higher returns, and existing owners availed themselves of improved market conditions to strategically fine-tune their portfolios. According to preliminary data generated by RCA, single-asset and portfolio hotel sales transaction volume soared, increasing by a whopping 47% to $41.0 billion (from $27.8 billion in 2017), recording the second-highest volume in the last decade, though still well below the $50 million achieved in 2015.
The average price per key for all sales (price of $2.5 million and over) increased by 21% from $127,000 in 2017 to $153,000 in 2018, driven by the sale of a greater number of larger, higher-priced hotels. Total volume for hotels that sold for $10 million and over (major hotel sales) increased by a substantial 56%, while the number of hotels that sold in this price category increased by only 6%, reflecting that larger, higher-priced deals drove the volume increase. The average price per key increased by 24%, from $221,000 to $274,000.
2018 U.S. Hotel Sales Transaction Volume and Average Price Per Key
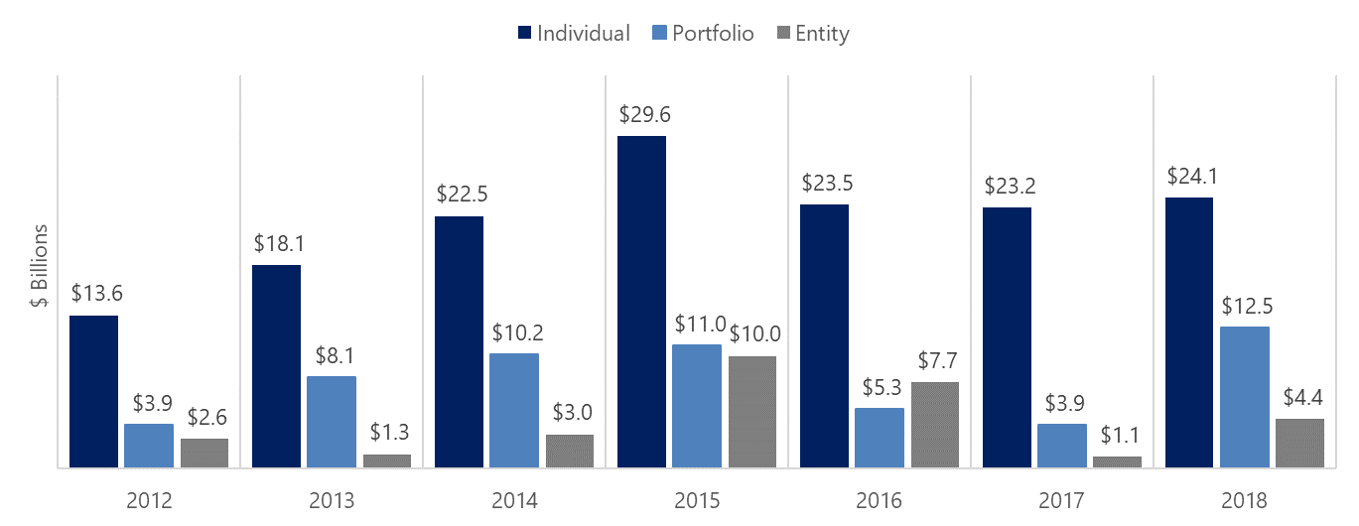
Individual property sales volume increased by a modest 3.8%. The volume of portfolio transactions, defined by RCA as the sale of two or more hotels, increased by 220%, from $3.9 billion in 2017 to $12.5 billion in 2018. A greater number of large, high-priced deals also drove up sales volume; five hotels transacted at prices exceeding $500 million, including the Plaza in NYC that sold for $600 million ($2.6 million per key), as well as two Waldorf Astoria resorts, the Grand Wailea that sold for $1.1 billion ($1,312,000 per key) and the Boca Raton Resort and Club that sold for $1 billion ($955,000 per key). The Grand Wailea was one of a three-hotel portfolio that sold for $1.06 billion. Pebblebrook’s acquisition of LaSalle in the 4th quarter for $4.4 billion was the year’s only entity transaction.
2018 Sales Volume: Individual Asset, Portfolio, and Entity
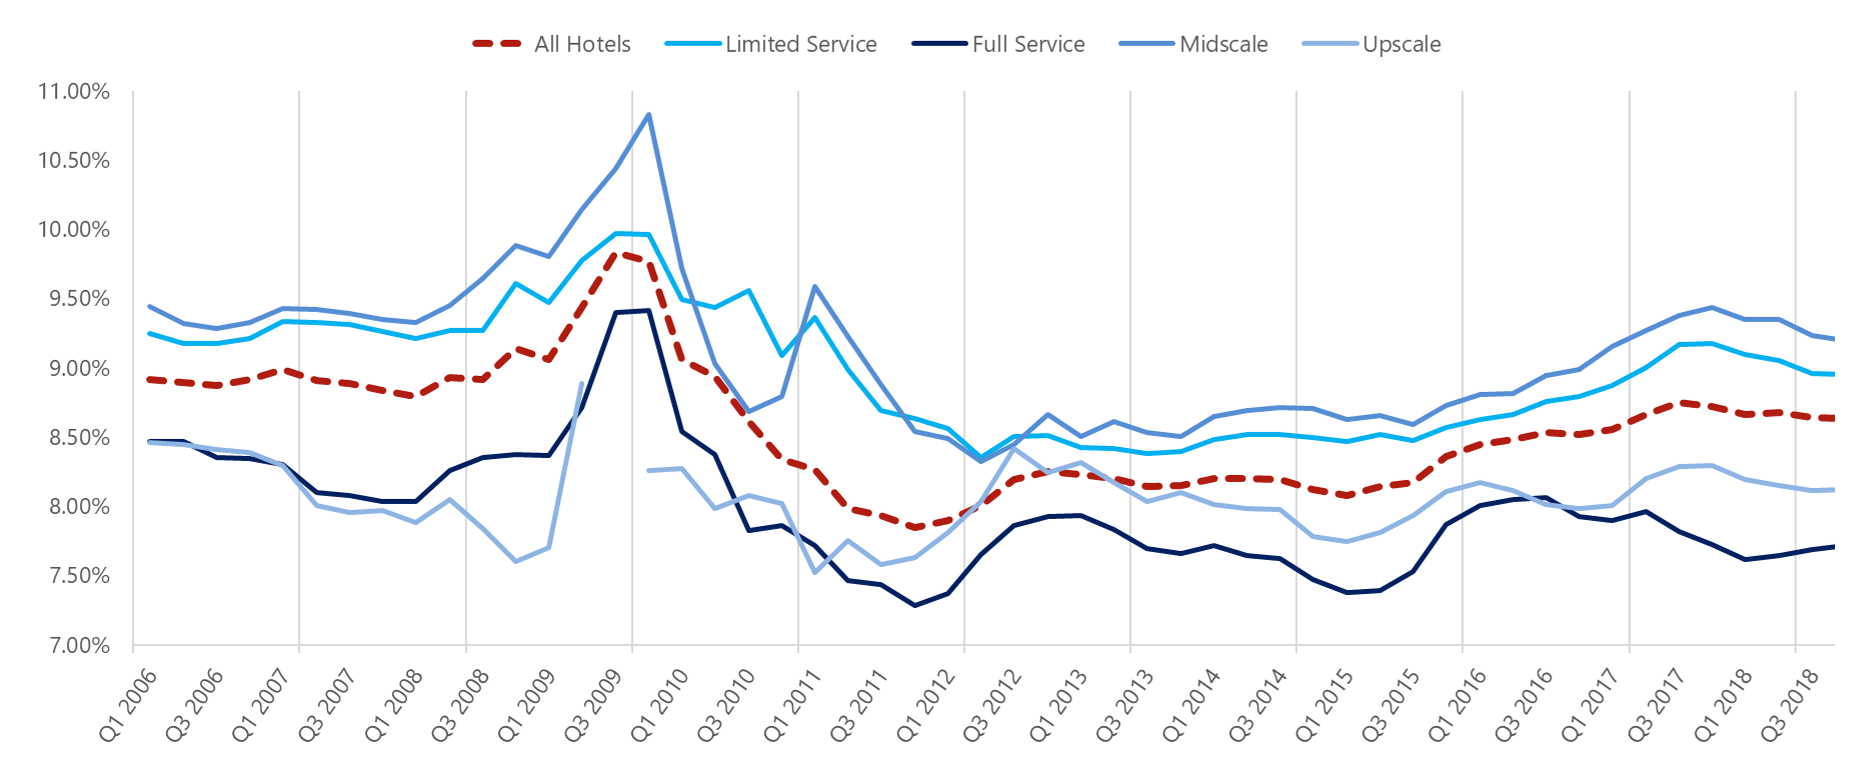
After rising from 2016 to late 2017, the RCA data set forth below indicate that capitalization rates contracted modestly, a reflection of the types of assets sold and a more optimistic outlook for hotel performance.
Capitalization Rates Derived From Sales Transactions
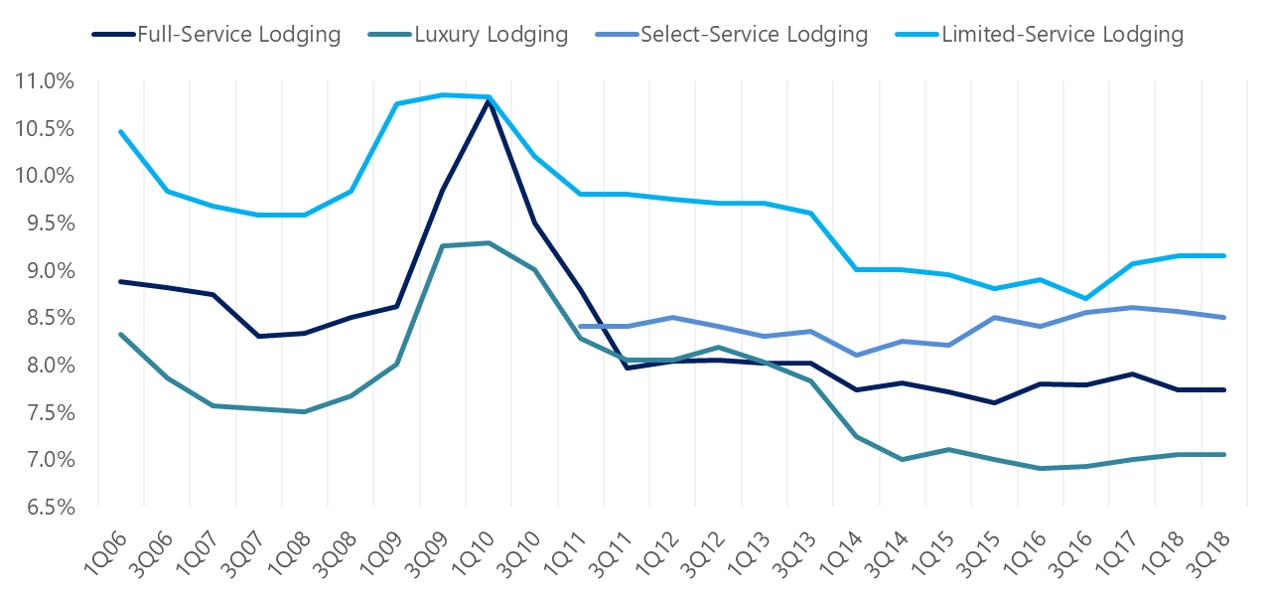
Hotel cap-rate trends based on investor surveys have followed a similar trend, declining through mid-year 2015 and then remaining steady (Luxury and Full-Service Lodging) or rising modestly (Select-Service and Limited-Service Lodging).
Capitalization Rate Trends: PWC Real Estate Investor Survey
The following chart sets forth average capitalization rates derived from sales based on trailing-twelve-month (TTM) net operating income (NOI) and projected first-year NOI at the time of sale. These rates are derived from hotels that HVS appraised at the time of sale; the derived capitalization rates are dependent upon the individual sales transactions that constitute the data set and reflect the wide range of cap rates for hotel transactions. A modest downward trend in 2018 is in keeping with the RCA and PWC data.
Capitalization Rates Derived From Sales Transactions*

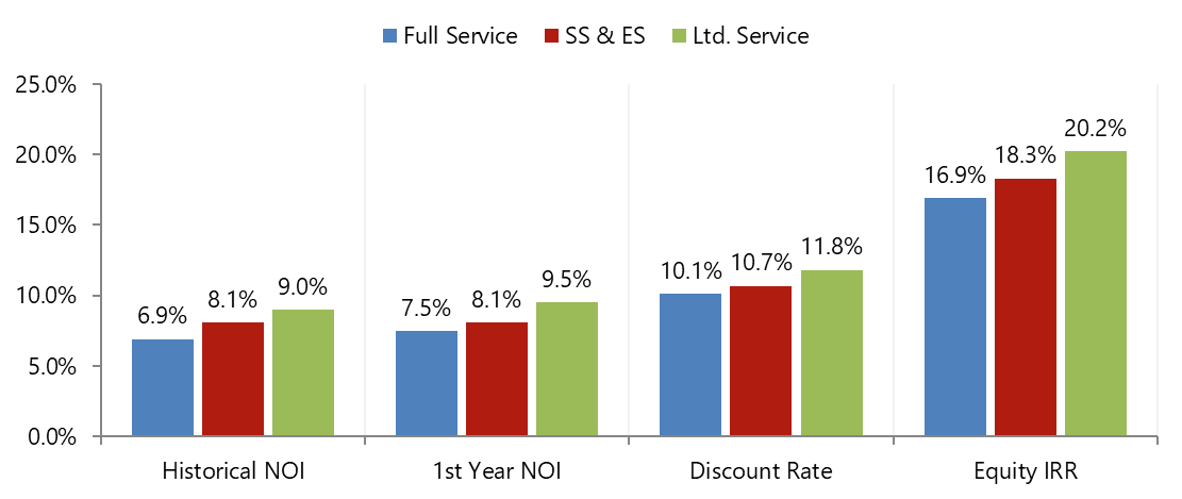
HVS derives capitalization rates based on TTM and projected Year-One NOI, while discount rates and equity internal rates of return (IRRs) are calculated based on the forward-looking projections and debt-service assumptions in the appraisal. The following data reflect the step-up in rates of return from full-service to select-service and limited-service lodging products. Discount rates have remained generally steady, while equity yields have continued to decline modestly, indicating that equity is reducing return expectations as NOI growth slows and interest rates rise.
Average Rates of Return Derived From 2018 Sales Transactions
With the anticipation of further rate increases by the Fed in 2019, broadening spreads due to economic uncertainty, and a widening gap between buyer and seller expectations, cap rates may finally start to rise. The public markets are early indicators and respond to changes in economic conditions more quickly than the asset transaction market. The following chart sets forth implied nominal capitalization rates based on the EBITDA generated by the REIT divided by the REIT’s total enterprise value (stock value plus liabilities). Note that EBITDA is reported prior to a reserve for replacement, which we estimate ranges from 80 to 130 basis points, so the equivalent cap rate for hotel valuation purposes would be about 100 basis points less, on average. REIT cap rates held steady through most of 2018 until spiking in December due to the stock market correction.
Implied Lodging REIT Cap Rates [2]
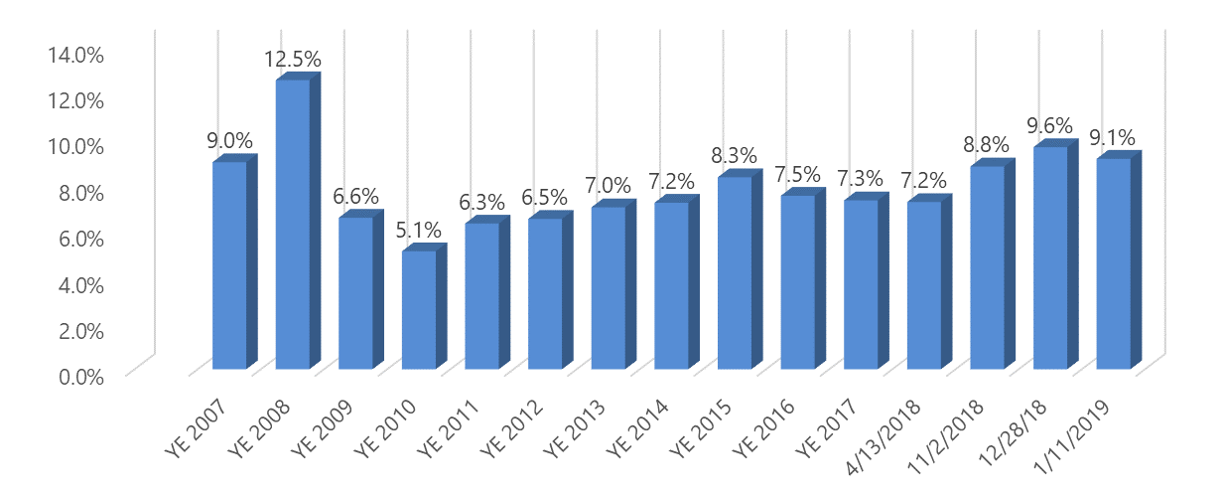
Publicly traded lodging REITs took a beating in late 2018, with their assets trading at a significant discount to underlying asset value. As of year-end 2018, implied lodging REIT cap rates had increased by 230 basis points from year-end 2017 because of the stock market correction and concern regarding slowing hotel NOI growth and higher interest rates. As of January 11, 2019, implied lodging REIT cap rates had moderated to 9.2%. The market is concerned about the impact of the slowing Chinese and EU economies, trade wars, a potential slowdown in U.S. capital investment, and rising interest rates—factors that could ultimately influence the U.S. economy. While economists continue to reiterate that the U.S. economy is on sound footing, the ripple effect of these factors is only starting to be fully felt. On the positive side, two-thirds of the U.S. economy is consumer driven, unemployment remains at record lows, wages are rising, and tax refunds should continue to provide an economic stimulus. Both debt and equity capital continue to be widely available for the lodging sector, though underwriting has become more stringent, lowering loan proceeds. Given the near-term outlook, more investors are likely to factor the anticipation of a slowdown into their purchase price decisions. With RevPAR increases projected in the +/-2.5% range for 2019, it will be challenging for many hotels to sustain current NOI levels. Looking beyond the near term, hotel supply increases are slowing, while growth in domestic and international travel is expected to generate sustained long-term lodging demand growth. How these factors play out into asset pricing will depend upon the characteristics of individual markets and hotel assets.
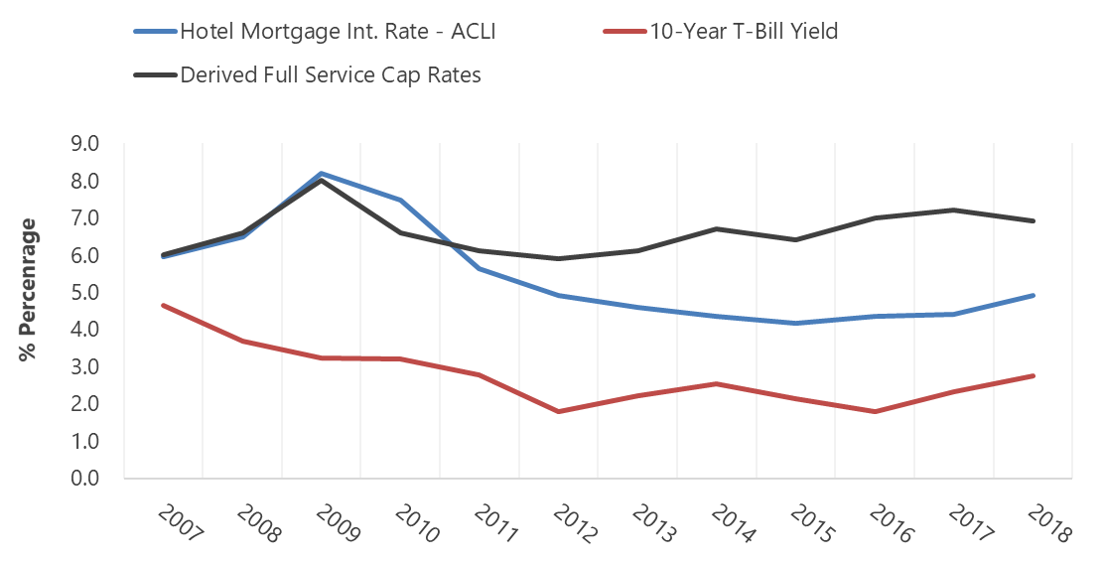
Interest rates have a direct impact on capitalization rates and values. The Fed raised the federal funds rate three times in 2018, to a current target range of 2.0% to 2.25%, and expectations are for two more increases in 2019. Increases in the federal funds rate had not impacted hotel mortgage interest rates to any significant degree over the past three years; however, market uncertainty is causing an increase in spreads, and the cost of debt, albeit modest thus far, and interest rates remain very favorable. The following chart sets forth the trend in hotel mortgage interests as reported by the American Council of Life Insurers; these loans represent low LTV, high-quality loans made by insurance companies. The bottom line reflects the yield on the ten-year T-bill, while the top line reflects cap rates derived from the transaction of full-service hotels that HVS appraised at the time of sale.
Hotel Capitalization Rate and Mortgage Interest Rate Trends
Prior to the Great Recession, cap rates and interest rates aligned, leaving little cushion to weather a downturn. Both interest rates and cap rates started to decline markedly in 2010 as hotel performance bottomed out and the expectation of a recovery became evident. Since 2014, hotel mortgage interest rates have held steady at 200 to 250 bps below hotel cap rates, indicating that we are in much better condition to weather a downturn.
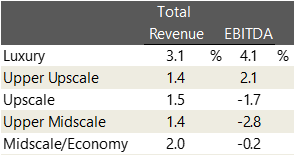
The impact of interest rate and NOI increases/decreases was explored in my January 2018 Cap Rate article. As hotels balance on the precipice of NOI declines due to rising operating costs and modest RevPAR increases, the projected slowing of real GDP and RevPAR growth is of concern. According to STR, approximately half the hotels in the U.S. realized a gain in gross operating profit (GOP) in 2017, with the remaning 50% experiencing a decline. The following chart sets forth a “same store” analysis of total revenue and EBITDA taken from the STR HOST Almanac 2018 report, based on 2017 financial performance.
STR Host Almanac – 2017 "Same Store" Statistics
The data reflect that the lower three tiers of STR chain scale “same store” properties experienced less than inflationary revenue increases in 2017 and slight declines in EBITDA. Such a trend would not be that signficant if the outlook for a recovery was imminent. However, the skies that brightened with stronger GDP growth in 2018 have turned cloudy again, and exactly when the upside to hotel investment will return is uncertain.
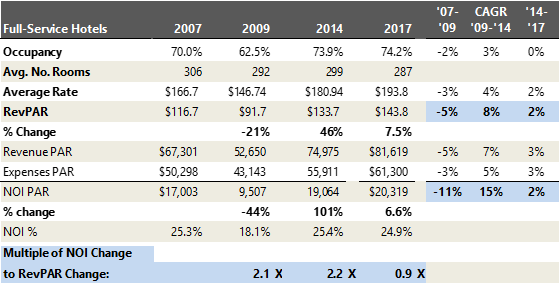
The positive operating leverage that has resulted in such significant hotel value gains over the past eight years is turning into negative leverage for some properties given that RevPAR growth has slowed to inflationary levels. The following chart sets forth the average operating performance of full-service U.S. hotels at the peak of the cycle (2007) adjacent to the trough of the recession (2009), followed by the same data for 2014 and 2017, as reported by STR. It is interesting to note that the broad rule of thumb that changes in RevPAR have two times the impact on NOI appears to hold true. The 21% RevPAR decline from 2007 to 2009 resulted in a 44% decline in NOI (negative operating leverage), while the 46% RevPAR increase from 2009 to 2014 resulted in a 101% increase in NOI (positive operating leverage). The significant operating leverage is due to the high fixed expenses of a hotel operation, which, once exceeded, generate strong gains in NOI when revenue is rising at a greater rate than expenses, and signficant declines in NOI when RevPAR declines. For the 2007 to 2009 and the 2009 to 2014 timeframes, the leverage equated to 2xs (i.e., the change in NOI was twice that of RevPAR in both the positive and negative circumstances). In the current market, hotel revenue is increasing at a rate equal to or less than expenses for many hotels, indicating a lack of positive leverage in the near term. From 2014 to 2017, RevPAR increased by a CAGR of 7.5%, while NOI increased by a CAGR of 6.6%, equal to a multiple of 0.9X, indicating that for every 1% of RevPAR gain, NOI increased by 0.9%. Note that this analysis is based on composite operating data and includes hotels with NOI affected by renovations and new hotel ramp-ups, which magnifies the impact of low RevPAR growth to some degree.
U.S. Full-Service Hotel Operating Leverage Analysis
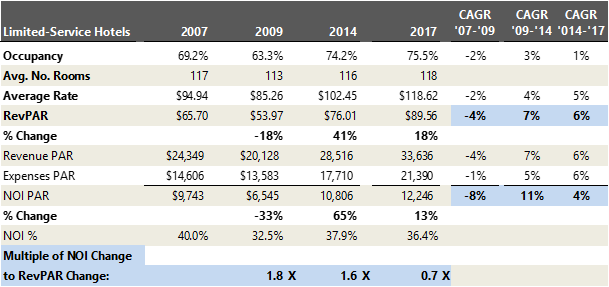
The same rule of thumb applies to limited-service hotels, but with a somewhat lesser impact in both negative and positive operating leverage scenarios due to lower levels of variable operating costs. From 2014 to 2017, the NOI to RevPAR change multiple decreased to 0.7X, indicating that for every 1% of RevPAR gain, NOI increased by 0.7%.
U.S. Limited-Service Hotel Operating Leverage Analysis
As hotels struggle to sustain NOI levels, values will come under increasing pressure. Many assets will continue to appreciate, driven by outsized market performance, targeted operational strategies, and capital improvements. However, value declines will likely surface for some assets in annual financial reporting and in the sale and refinancing process. According to Trepp, hotel loans represent 31% of the $40.9 billion and $44.0 billion of loans maturing in 2019 and 2020, respectively. Trepp’s analysis indicates that, with no further interest rate increases, just 63% of lodging loans would meet their loan-to-value hurdles, and with a 50-bps interest rate increase, that ratio declines to 57%. Prudent hotel investors, operators, and lenders are proactively addressing this stage of the investment cycle.
Outlook for 2019
In summary, hotel transaction activity is expected to continue to be relatively strong in 2019, though overall volume is anticipated to decline from 2018 levels. Slowing RevPAR growth and operating cost increases will continue to put pressure on hotel NOI and values. Many hotels will continue to benefit from strong demand and increasing revenue. However, with operating leverage turning negative for some hotels, the potential for value declines will become more prevalent. Hotel investment is a market-by-market, corner-by-corner business, and while some hotels will struggle during a slower growth period, others will continue to appreciate due to strong local market conditions and asset characteristics. Once the clouds clear, hotels should be able to once again benefit from the positive operating leverage that makes them attractive investments.
[1] The author publishes an article that focuses on hotel capitalization rates in January of each year; these may be accessed at hvs.com/publications/mellen. If you are looking to update any specific data from prior articles not found in this article, please email the author at smellen@hvs.com. [2] Implied cap rates based on EBITDA prior to a reserve for replacement; cap rate w/reserve approximately +/-100 bps lower.


