By Adam Lair
In a recent New York Times op-ed titled Why Rate Cuts Don’t Help Much Anymore[1], Austan Goolsbee, former economic advisor to President Obama, cited a study on the effect of Federal Reserve rate cuts on demand for mortgages, stating:
Fundamentally, there wasn’t much pent-up demand for investment after years of low rates, accelerated depreciation, ‘temporary’ investment expensing, and other stimulus. The lack of pent up demand also means that cutting interest rates now is unlikely to entice businesses to invest much more.
In other words, to summarize Goolsbee’s general point, rate cuts don’t unleash the same impact on the economy they used to because at this point, ten years on, there isn’t much pent-up demand left to unleash. Companies seeking to make big investments have made them, and consumers and homeowners waiting to replace that expensive washer or dryer or to refinance a home have done so. And therein lies the problem with long economic cycles such as our current one: few people are left sitting on the sideline waiting to strike when the iron is hot because the iron has been hot for some time now.
We can draw an analogy between Goolsbee’s commentary on the larger economy and our own hotel industry. Why should consumer demand for hotel rooms be any different than for business investment or washers or dryers? Certainly, RevPAR has slowed, and occupancy looks choppy thus far in 2019. Is pent-up demand, or, to use the hotel consulting phraseology, unaccommodated demand, all but gone from the hotel space? Are we now standing on the precipice of the inevitable downturn? To make sense of it all, it helps to look past the more common indicators at some less-traditional data points.
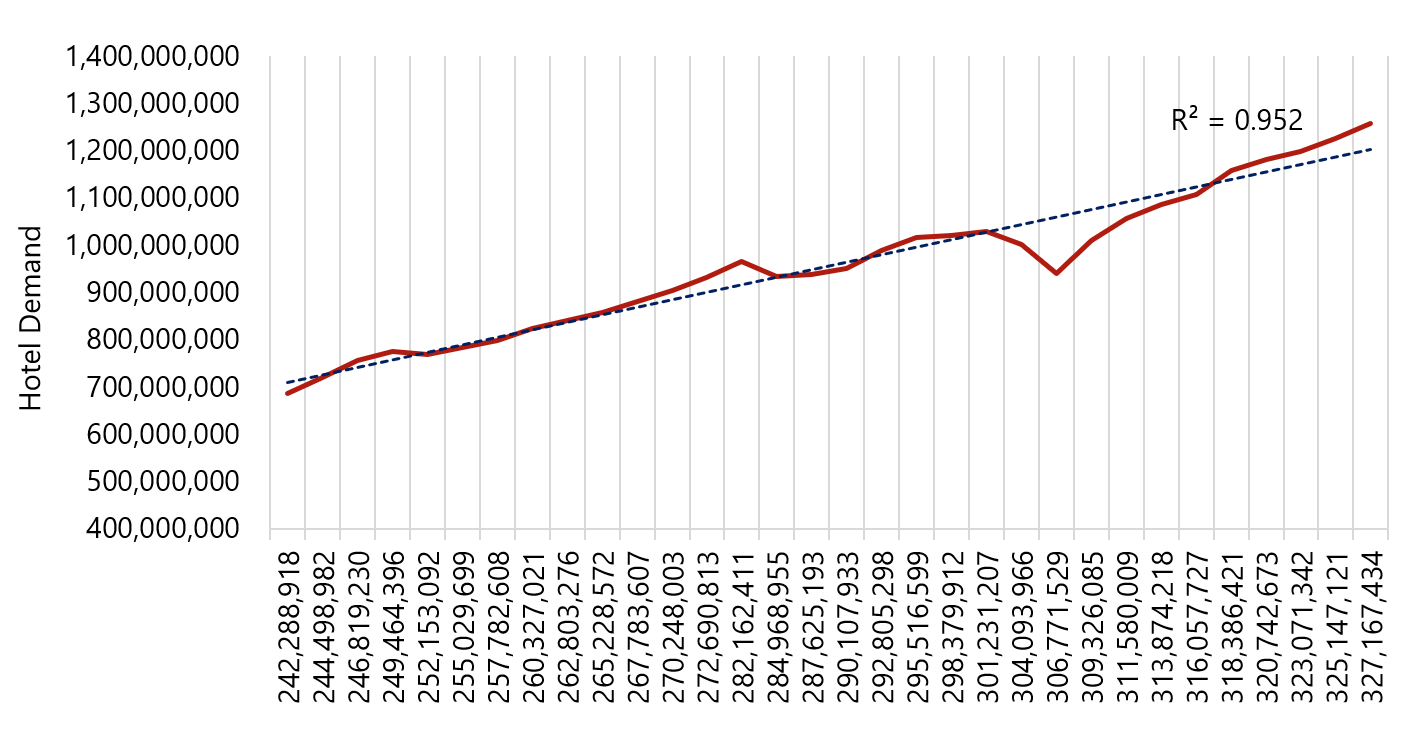
Like washers and dryers, demand for hotel rooms is, at its most basic level, tied to the number of people available to use them. Surely, other factors play a role (population age, employment levels, per-capita income, and GDP growth come to mind), but it stands to reason that without underlying population growth, it would take significant changes in these other factors to move the needle much in terms of demand. The following graph shows hotel demand as a function of population growth over the period from 1987 through 2018.
Indeed, when hotel demand is plotted against U.S. population growth over the same period, as illustrated above, the resulting R-squared is a very strong 0.952. The causality of this relationship notwithstanding, hotel demand is going up over time in line with population growth, which seems elementary. But while this provides a baseline for studying changes in demand, the increase in the number of hotel rooms has actually outpaced U.S. population growth by a fair margin.
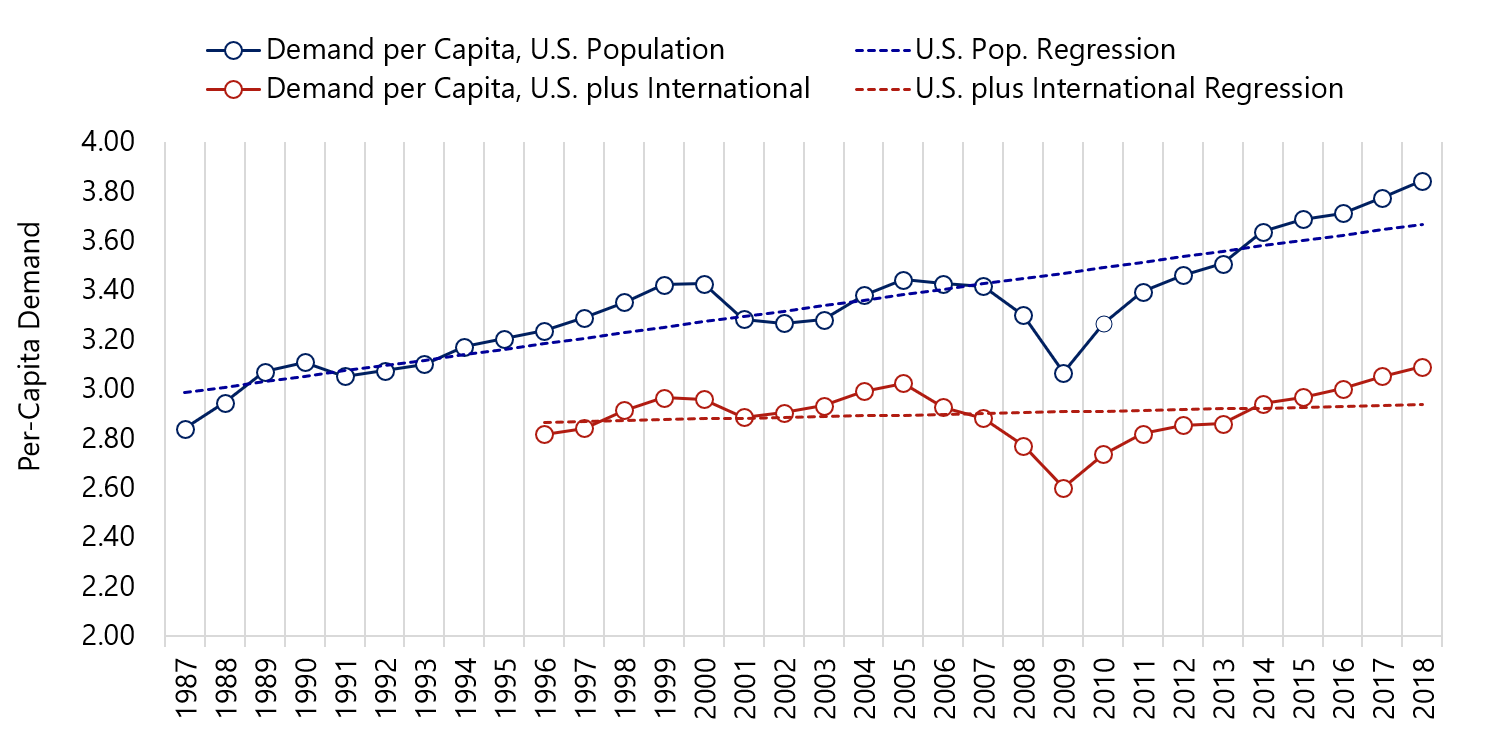
Going back to 1987, U.S. hotel demand has grown at an average annualized rate of 1.9%, while new hotel supply has grown at a slightly slower pace of 1.8%, resulting in our recent peak occupancy levels. Over the same period, however, the nation’s population has grown at an average pace of just under 1.0% and has slowed significantly in recent years, to just 0.6% in 2018. Layering in international visitation, which the National Travel & Tourism Office has tracked since 1996, results in a higher but still lagging rate of 1.3%. So what’s going on here? The following graph shows per-capita demand (the number of rooms rented per person) for both U.S. residents alone and the U.S. population plus international visitors.
Two things become clear when we look at the per-capita demand data. First, despite fluctuations, the number of hotel rooms needed by each person has risen over time, from 2.84 to 3.84 for U.S. residents alone and from 2.82 to 3.09 when adding international visitors. And while it may be true that part of the differential between the two is due to the fairly quick pace of growth in international visitation (3.5% annually on average) since 1996, demand is rising no matter how we slice it. This growth might be attributed to a variety of factors: the preference of the Millennial and Gen-Z generations for experiential travel, the increase in remote employees who travel sporadically to central business hubs, or the general increase in travel for both business and leisure. Global Workplace Analytics reports that telecommuting has increased 159% since 2005. Additionally, leisure travel increased 2.0% in 2018 and business travel 1.8%, according to the U.S. Travel Association, both much quicker paces than underlying population growth. The reasons behind this discrepancy could be the subject of a separate article.
The second insight, however, and the one that ties back to our original point about pent-up demand, is what the data tell us about how demand behaves during economic cycles. As we might have guessed, per-capita demand peaks just before or at the onset of recession and tends to reach its trough near the end of a downturn, when corporate spending cuts and consumer belt tightening are at their zenith. But the degree of rise and fall illustrates just how much per-capita demand has grown over time. During the three recessions since 1987 (1990/91, 2001, and 2007-09), hotel demand per U.S. resident has fallen an average of 5.8%. From trough to peak, however, demand has recovered 14.3% on average. When we remove the impact of the Great Recession (a 10.9% drop and 25.3% recovery), the difference is still stark, at 3.3% down and 8.9% up on average. Even the U.S. plus international figures, which lack the 1990/91 data point to temper the averages, show a decline of 8.3% and a recovery of 11.8%.
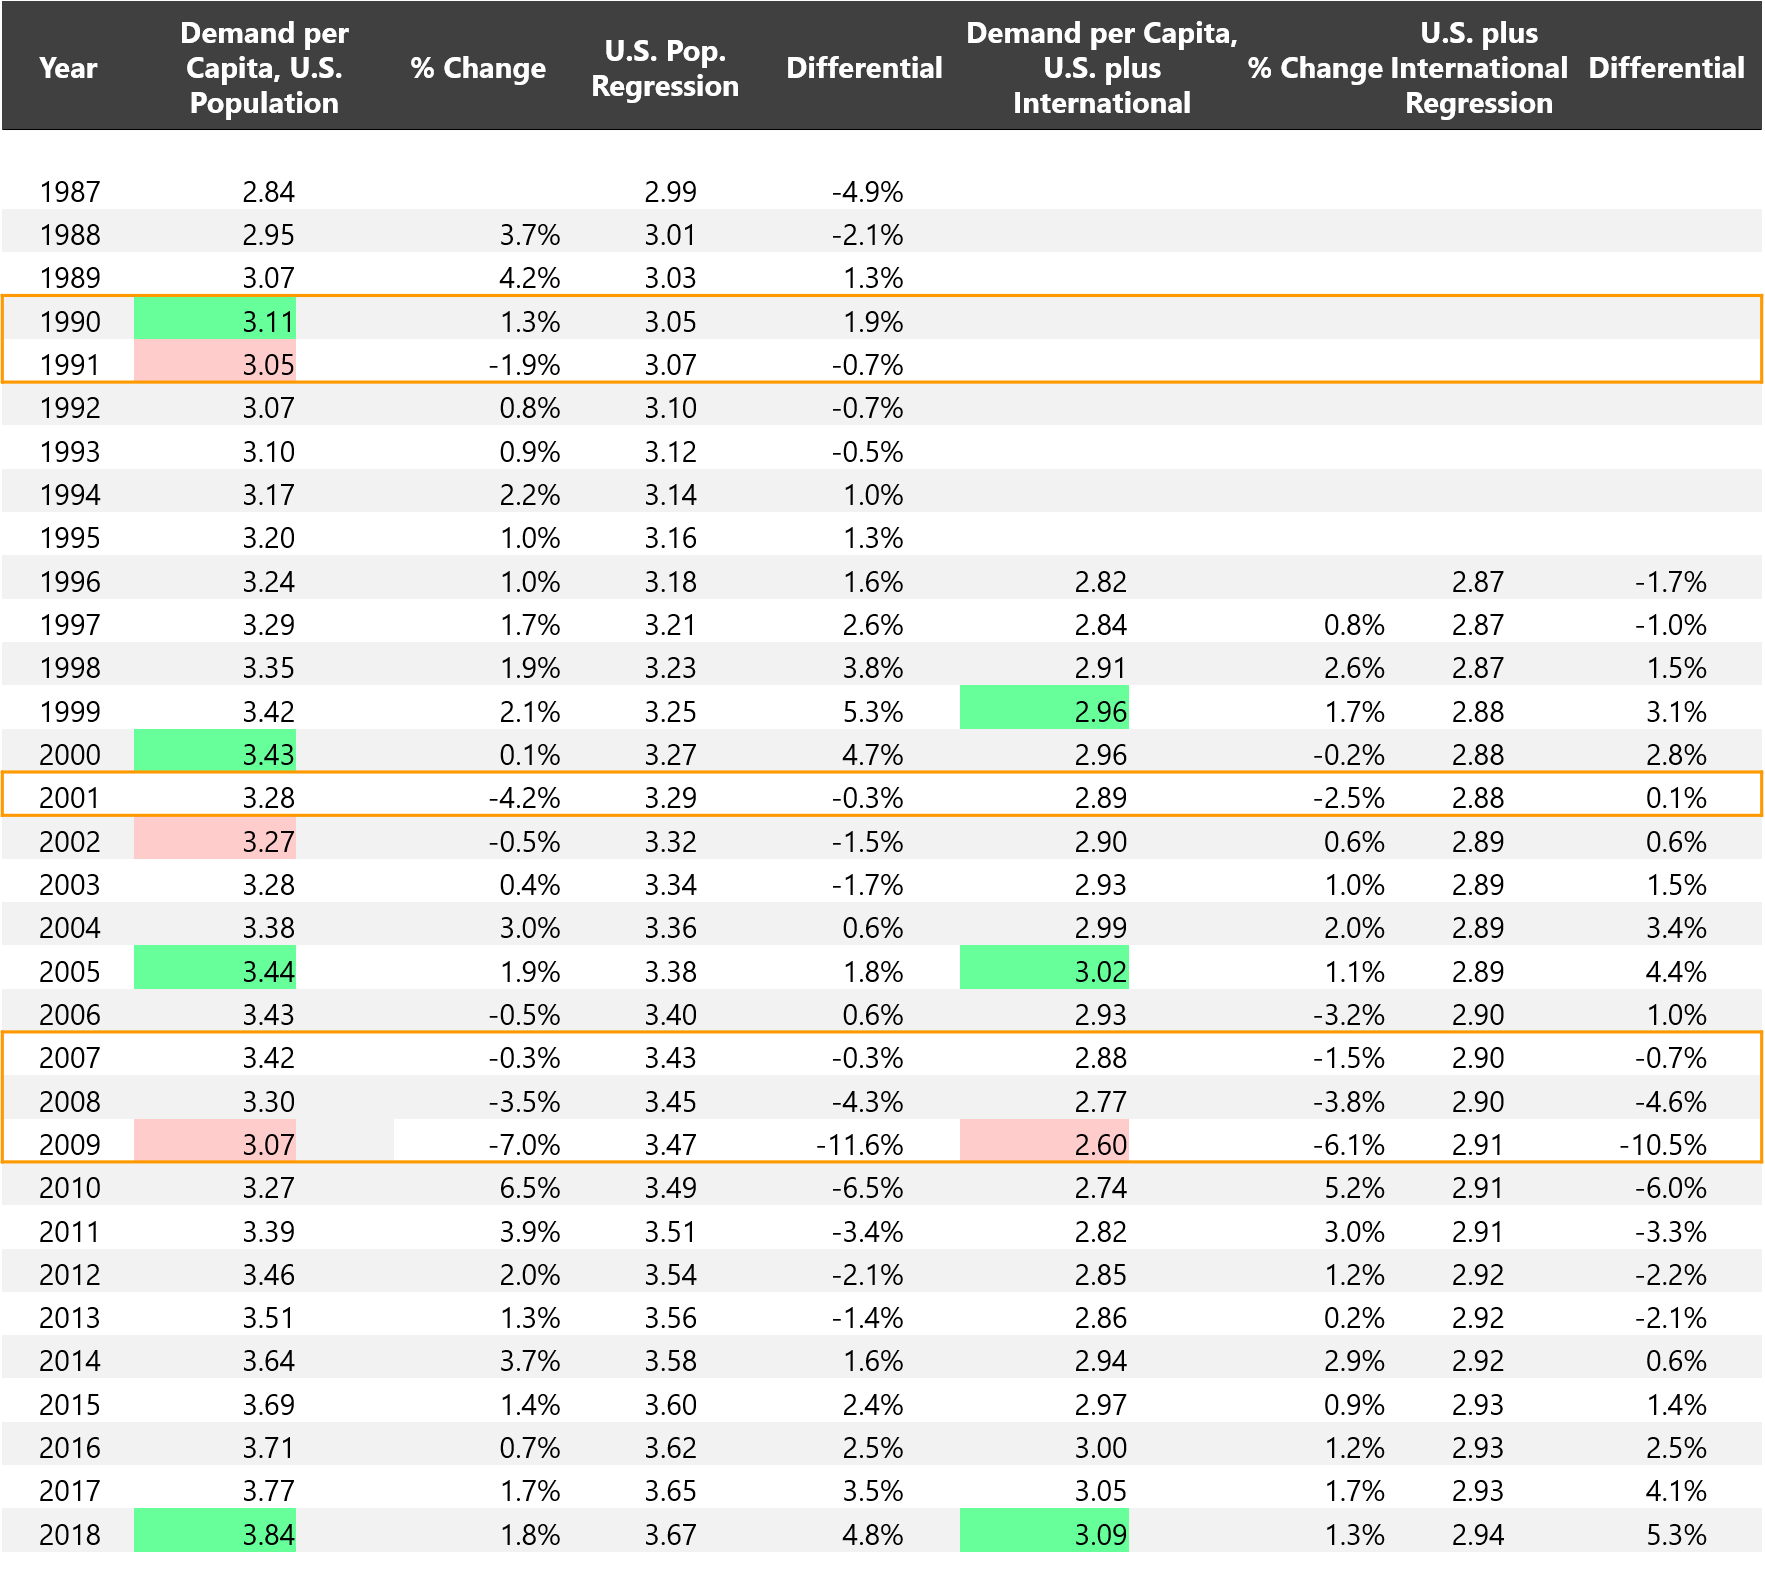
The question becomes, then, what these periods of decline and recovery look like in relation to the long-term growth trend in per-capita demand. To find an answer, we can run a simple linear regression analysis, shown in the following table. Here, the green highlighted cells represent per-capita demand peaks, the red cells troughs, and the outlined rows recessionary years.
Regression data for per-capita demand shows that demand per U.S. resident tends to fall an average of 4.7% below the trendline during recessionary troughs (5.2% for U.S. plus international) and recover by 1.4% each year through the following peak (also 1.4% for U.S. plus international). This is where unaccommodated demand comes into play. As the need for hotel rooms recovers, often exceeding the trendline in the second or third year of a recovery, new supply lags, creating a bottleneck in certain markets. Eventually, supply catches up, causing the release of the pent-up or unaccommodated demand Austan Goolsbee identified in his op-ed, and the per-capita demand growth begins to cool. In fact, growth in each of the 1990, 2000, and 2005 peak years was slower than the year immediately prior by at least 110 basis points.
So what do these data say about our current per-capita hotel demand? For starters, peak demand levels for U.S. residents alone have exceeded the regression trendline by an average of 3.5%, with the average for U.S. plus international a bit higher at 4.3%. Our current per-capita figures of 3.84 and 3.09, respectively, are historical peaks. Moreover, the variance of +4.8% for U.S. residents is the highest level since 1999, while the U.S. plus international figure of +5.3% reflects a historical peak by 90 basis points. One interesting bit of data, however, is per-capita demand growth, which accelerated slightly compared to 2017 and has been up since 2016, when U.S. GDP growth and the ISM Manufacturing Index were at or near five-year lows.
The data seem to indicate, then, that the hotel industry is near a demand peak, although how close we are to it is anyone’s guess. It’s worth noting that in each of the years immediately preceding a peak (1989, 1999, and 2004), per-capita demand growth had picked up from the year before, much like 2018. The availability heuristic has us conditioned to think the next downturn is just around the corner and to be wary of another Great Recession. But the data may show otherwise. Whenever the next recession does hit, per-capita demand is likely to decline modestly, recover quickly, and exceed the prior peak in relatively short order. For that reason, it pays to be mindful of how a decline could affect individual markets and where unaccommodated demand might pop up in the ensuing recovery.
[1] https://www.nytimes.com/2019/08/01/business/federal-reserve-rate-cut.html


