By Suzanne Mellen, CRE, MAI, ISHC, FRICS
Hotel values reached new peak levels in 2014, fueled by stellar hotel performance, and the availability and low cost of capital. Capitalization rates held steady as competition for quality assets remained strong. This article discusses these forces and presents data illustrating these trends.
The strong performance of hotel assets continues to attract capital to our industry. Hotel values reached new peak levels and capitalization rates remained steady in 2014, fueled by hearty net income increases and a plethora of low cost, yet still disciplined, capital. This article, which is published biennially (www.hvs.com/publications/mellen), discusses trends in hotel capitalization rates and provides an outlook for 2015.
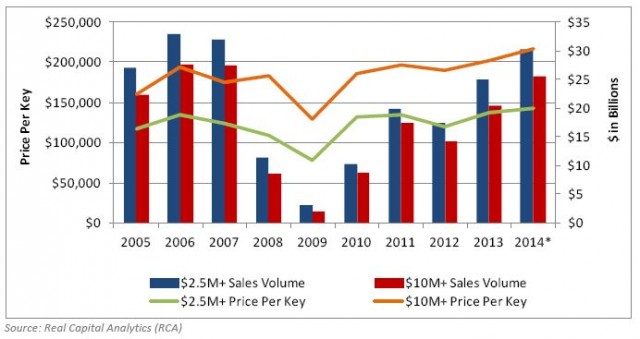
Hotel transaction activity was very robust over the past year, with total volume increasing 22% over that of 2013 based on preliminary data for hotels that sold at a price of $2.5 million and above, as reported by Real Capital Analytics (RCA). Total volume reached $30 billion, just $2 billion shy of the prior peak volume levels achieved in 2006 and 2007. Total volume for hotels priced at $10 million and over (major hotel sales) increased by 25%, while the number of hotels sold in this price tier increased by a dramatic 46%, as market transaction activity was dominated by the sale of limited service and select service hotels. The average price per key of the major sales increased by only 4%, from $202,000 to $217,000 per room, due to the greater proportion of smaller, lower priced deals that comprise the data. Large full service hotel transaction activity was relatively muted by comparison. Portfolio activity was a dominant factor, with ten select service hotel portfolios ranging from $100 million to $1.1 billion in total price transacting in 2014. Over one-third of the sales volume in 2014 was categorized by RCA as a portfolio transaction.
2014 HOTEL SALES TRANSACTIONS > $2.5 MILLION*
* Note that this data, provided by Real Capital Analytics, pertains to sales in excess of $2.5 million and should not be compared to data reported by HVS in prior capitalization rates articles written by this author.
Sales volume is expected to further increase in 2015 as more sellers place their assets on the market and REITs, driven by yield hungry investors, and international buyers, looking for a safe haven for their capital, continue to pick up their acquisition activity. The large volume of CMBS debt that will reach maturity in 2015 will be another catalyst for sales transactions, in addition to refinancing activity. Factors external to the US, such as the economic woes in Europe and the slowing of the Chinese economy, do not appear to be suppressing investor sentiment at the moment, but there is always a concern that international economic flux could lead to the stalling of transaction activity.
The welcome surprise of the year has been the robust performance of hotels in the United States, with RevPAR increasing over 8%, and NOI as reported by PKF increasing by 13.2%. With the cost of capital and capitalization rates remaining steady, hotels appreciated at an unprecedented rate for this point in the cycle. Uncertainty over the debt ceiling and a federal sequester, which fell by the wayside in mid-2013 as the national elections approached, left the economic recovery free to finally take root. Post election performance has been even stronger. Supported by low interest rates and loosening lender purse strings, business activity finally took flight and was rewarded with robust stock market gains. Business travel followed suit, leisure demand continued to strengthen and finally the group market began to strongly recover. Strong RevPAR gains and positive operating leverage resulted in substantial increases in hotel NOI that has resulted in robust asset appreciation across all product tiers.
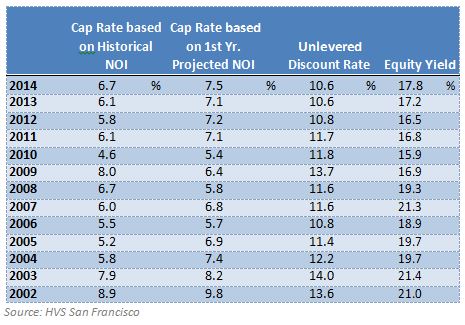
Typically, as an investor's expectations of near term income gains are achieved, capitalization rates rise. However, higher loan-to-value ratios, the prospect of continued strong NOI increases and investor competition are keeping hotel capitalization rates in check. These counterbalancing factors have kept capitalization rates steady, as evidenced by the data derived from hotel transactions that HVS appraised at the time of sale. The following chart sets forth the historical trend in full service hotel rates of return.
DERIVED AND PROJECTED CAPITALIZATION AND DISCOUNT RATES – SELECT SET OF FULL SERVICE HOTELS
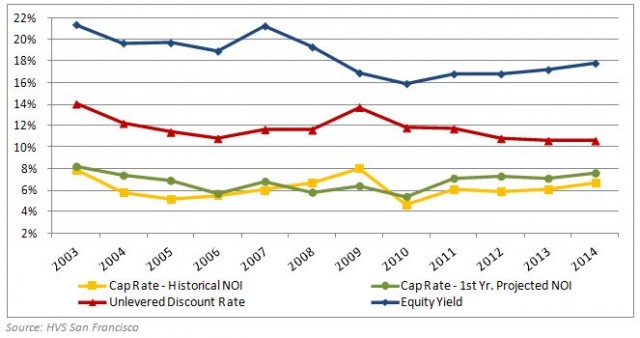
The same data are reflected in the following chart. Capitalization rates based on historic net income remain above going-in capitalization rates based on projected first year net income, reflecting that the market anticipates continued increases in hotel net income.
DERIVED AND PROJECTED CAPITALIZATION AND DISCOUNT RATES – SELECT SET OF FULL SERVICE HOTELS
Overall capitalization rates based on historical net income remain in the 6% to 7% range for full service hotels, and "going-in" cap rates based on projected year one NOI continue to be 50 to 100 basis points higher, reflecting the increase in NOI anticipated by investors. Discount rates have declined to the mid-10% range, while equity yields have trended upwards due to higher leverage levels. We note that these are averages, and rates of return can vary signficantly for individual assets.
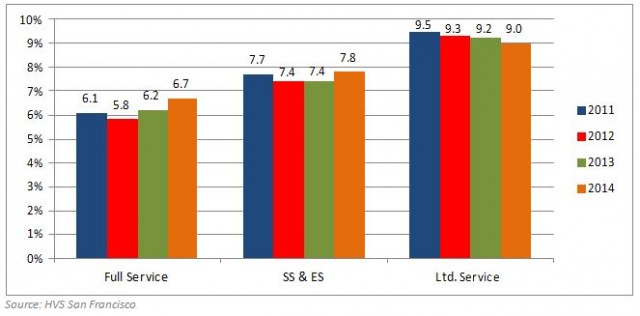
Data captured by HVS for select service and limited service hotels over the past four years reflect similar trends. "Select Service" is broadly defined as upscale limited service, select service and extended-stay hotels, while "Limited Service" hotels are defined in the mid-rate and economy chain scales.
COMPARATIVE AVERAGE CAP RATES DERIVED ON HISTORICAL NOI
We note that the derived capitalization rates are dependent upon the individual sales transactions that comprise the data set. The wide range in cap rates is evidenced in the chart below. Individual sales transactions can impact the cap rate range and average.
CAPITALIZATION RATES DERIVED FROM SALES TRANSACTIONS – HISTORICAL NOI
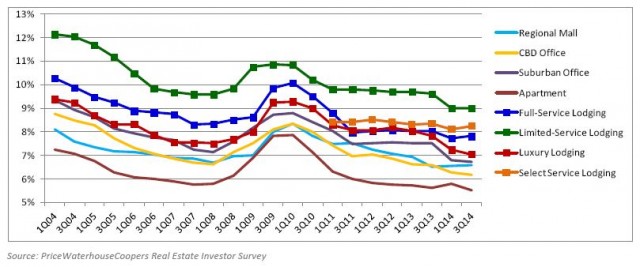
Capitalization rates derived from investor surveys, as presented in the following chart, generally support these trends, though we note that a disconnect remains between cap rates for the full service and luxury product category based on what investors say they want to yield (survey data) and the rates of return derived from actual sales transactions. Most investors are expecting strong cash-on-cash returns upon acquisition. The following chart illustrates capitalization rates for the four hotel product types set forth the in the PWC Real Estate Investor Survey, which reports hotel rates of return based on surveys of investors the first and third quarter of each year. Cap rate trends for other forms of commercial real estate are set forth for comparison.
PWC REAL ESTATE INVESTOR SURVEY – HOTEL CAPITALIZATION RATES
These data reflect rate of return requirements based on a survey of real estate participants. Hotels continue to retain their premium over other types of commercial real estate, as reflected by the hotel capitalization rates which occupy the top four lines in this chart. Of note is that the premium pricing associated with luxury hotel assets has returned, with capitalization rates once again dipping below those of full service hotels and nearing the returns of suburban office space.
While the survey data seem to indicate that return requirements have declined over the past 18 months, the data are now more in line with the capitalization rates that have been in evidence based on sales transactions over the past four years, as reflected in the preceding charts.
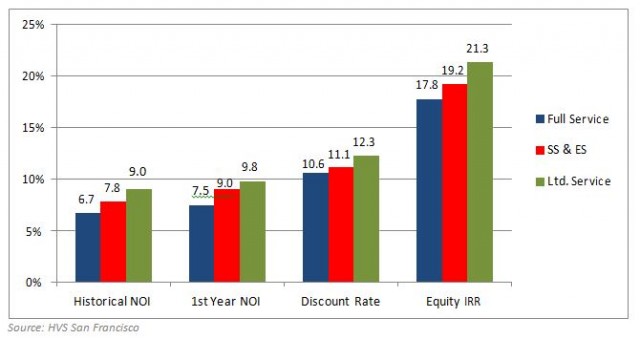
The following chart, which illustrates capitalization rates and internal rates of return by product segment, reflects the step-up in rates of return from the full service to select service and limited service sectors. "Going-in" capitalization rates, derived from projected first year NOI divided by the purchase price, range from 80 to 120 basis points above cap rates derived based on historical NOI, reflecting the expectation of future increases in NOI by investors. Free and clear, unlevered discount rates remain 200 to 300 basis points above "going-in" cap rates. Equity internal rates of return have increased over the past couple of years reflecting the positive impact of higher LTVs.
AVERAGE RATES OF RETURN DERIVED FROM 2014 SALES TRANSACTIONS – BASED ON HISTORICAL NOI
The cost of capital is the primary driver of cap rate trends. The Federal Reserve has maintained the federal funds rate below 0.25% since December 2008 – the lowest rates over the past 60 years – providing an unprecedented interest rate environment. After some volatility over the past two years, hotel mortgage interest rates have returned to their historic lows. Given the current strength of the economy, with GDP increasing 5% in the 3rd quarter of 2014, an 11-year high, economists are projecting the Fed to start to raise interest rates in the second half of 2015. However, with the decline in the price of oil, the economic woes of Europe, and slowing of the Chinese economy, interest rate increases may be postponed. This may be a favorable factor for our industry, but it may also signal some headwinds for hotel performance and appreciation, particularly in gateway markets due to the strength of the dollar, and in markets with energy-based economies. Nothing on the near term horizon appears to indicate that capitalization rates will rise because of interest rate hikes. If uncertainty continues resulting in a change in business and consumer behavior, then capitalization rates may rise owing to fears of future flattening or declining hotel income. At the current time, industry prognosticators remain extremely bullish and anticipate another strong year of RevPAR and net income growth in 2015, which should help to keep capitalization rates stable.
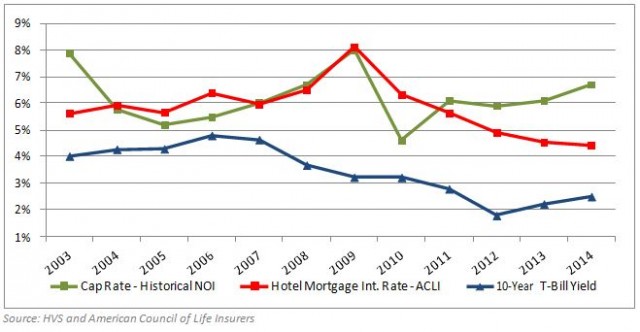
The following chart presents the derived capitalization rates for full service hotels (green line), as compared with the yield on the 10-year treasury and hotel mortage interest rates as reported by the American Council of Life Insurers. Cap rates, which reflect a weighted cost of capital, currently exceed the cost of debt, as is appropriate in the capital stack. Contrast this with the situation in the
2004 through 2007 period when hotel mortgage interest rates exceeded capitalization rates, indicating that investors were not being adequately compensated for the risk of their position. The current healthy balance between capitalization rates and the cost of debt reflects a disciplined market that should be better able to weather any future downturn, though we caution that increasing loan-to-value ratios are raising the risk of overleveraging as the cycle advances.
HOTEL CAPITALIZATION RATE AND MORTGAGE INTEREST RATE TRENDS
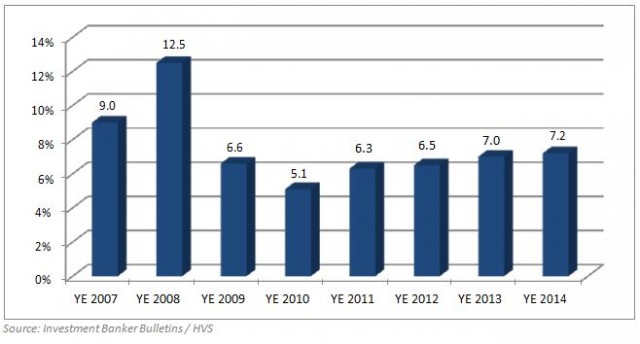
The stock market is generally viewed as a leading indicator, and capitalization rates derived from publicly traded REITs can provide insight into future trends. The following chart illustrates average historical implied REIT cap rates derived from investment banker bulletins, calculated as EBITDA divided by enterprise value (equity plus debt) as of calendar year end. Implied REIT capitalization rates have been trending up gradually over the past five years, reflecting the quest by investors for higher cash flow returns as the potential for significant appreciation wanes. While industry participants are confident about the near term prospects for hotel performance, the uncertainty regarding 2017 and beyond may start to impact investor pricing decisions.
CAPITALIZATON RATES DERIVED FROM SELECT LODGING REIT DATA
These data reflect that as the presently robust hotel RevPAR and net income gains start to slow we will likely see some increases in capitalization rates. The degree to which cap rates rise will depend upon interest rates and the outlook for hotel performance at that time.
Outlook for 2015 Given the expectation of strong, albeit slowing RevPAR growth in 2015, and the continuation of a low interest rate environment, we anticipate that hotel capitalization rates will remain generally stable throughout the year, barring any unforeseen global or economic shock. While local economic factors and new additions to supply will dampen asset appreciation in some sub-markets, U.S. hotel values should continue to rise at strong rates in 2015.


