By Carrie Russell, Tom Beckett, Lily Li
Introduction
In 2018, the Canadian lodging market reached a new record high for RevPAR. Although regional performance differed widely, more developments are in the pipeline in 2018 that any year since 2013. After the global financial crisis hit the Canadian lodging market in 2009, causing a 12.3% contraction in RevPAR, the industry in general has been on an upward trajectory. In fact, RevPAR growth for the country has been registered for 106 consecutive months—the longest period of sustained growth on record.
Strong metrics in many hotel markets, availability of competitive debt financing, and yield-seeking investors have led to the development of new assets. The development of new hotel projects gained momentum in recent years; nearly 30,000 new hotel rooms across more than 250 projects, currently in various stages of the planning process are in the new supply pipeline for 2018. While it is unlikely all projects will see their way to development, HVS forecasts supply growth to average 2.0% per year over the next three years.
HVS has been tracking hotel development costs for the last three decades by collecting data of actual hotel build costs and proposed hotel construction budgets during our assignments from coast to coast to coast. This is the first year that HVS Canada has published the Canadian Hotel Development Cost Survey and the diverse sample of hotels reflects our growing presence in all ten provinces and three territories in Canada.
Our 2018 survey reports per-room hotel development costs based on data compiled by HVS from hotel projects proposed and under construction from the beginning of 2015 through the end of 2018, and data from surveyed respondents who opened a new hotel during that time period. We have chosen to group the results into five product categories: economy hotels, midscale/upper-midscale hotels without food and beverage, extended-stay hotels (includes both midscale and upscale hotels), upscale select-service hotels, and full-service hotels.
The HVS Hotel Development Cost Survey presents the average development cost per room in each product category. Development costs change from year-to-year, market-to-market, and site-to-site and as such the results are best used as a broad measure of generally applicable metrics or ratios; special consideration needs to be given to specific projects, building materials, and locations. Our goal in sharing this information is to provide developers, appraisers, consultants, and other stakeholders in the market with support for preliminary cost estimates of hotel development projects, as well as to show a cost comparison across the different product categories.
Demand Outpaces Supply Growth Nationally, Continuing to Fuel Positive Hotel Performance
According to STR, Canadian Hotels reported a 2018 year-end ADR of $163 and an occupancy of 67%. This marks yet another record year for RevPAR in Canada as it has exceeded the 2008 record of $85 each year since 2013. RevPAR growth reached its fastest clip in 2017 at 7.7%. In 2018, RevPAR growth moderated to a still notable 5.3%.
Supply growth over the past decade has been limited across the country and the best-performing markets have significant barriers to entry. Improvement in top-line performance has not always translated into more proposed supply as operating costs have continued to climb in many markets and competition with other developments has driven up the cost of labour, both construction and operational talent, as well as the cost of the best development sites. Canada is fairly notorious for its long winters and pronounced seasonality, both of which have limited the markets’ ability to dramatically grow occupancy. Many markets, fortunate to have significant unaccommodated demand during peak periods, are now pushing room rates higher, which has resulted in significant RevPAR increases since 2013.
Hotel Development Cost Categories
The Uniform System of Accounts for the Lodging Industry (USALI) provides industry participants with a common language for analyzing the financial performance of a hotel. However, a consistent format for development budget is sadly lacking. As consultants preparing feasibility studies and as appraisers developing opinions of value for construction financing, we have reviewed hundreds of hotel development budgets. We are often asked for input on hotel development budgets and find that a lack of common language for identifying relevant cost items is indeed a challenge for industry participants.
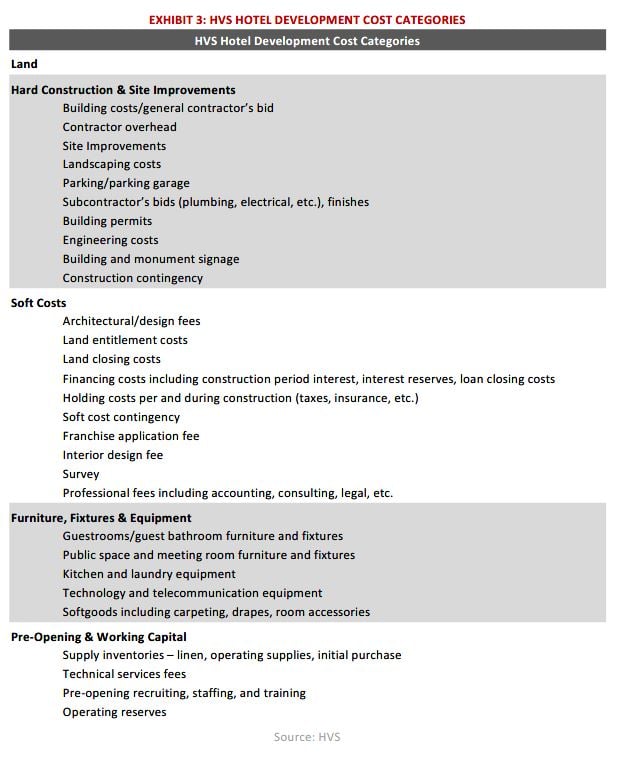
For the purposes of preparing the HVS Hotel Development Cost Survey, we have broken the elements of a hotel development budget into five categories: land; hard construction and site improvements; soft costs; furniture, fixtures and equipment (FF&E); and pre-opening and working capital. We find these categories to be meaningful for hotel professionals when undertaking an analysis related to hotel feasibility and valuation. The classifications are also broad enough that professionals with different expertise can work with and understand them. While our category structures are not an accounting practice, they do provide a basis from which to analyze and compare proposed projects.
The following chart shows our five categories and the typical items that each includes.
Land
Oftentimes, the dollar amount of land in a development budget can be based on actual acquisitions, appraised value, or as equity contributions by parties to the deal. For many projects, the land may have been acquired several years prior to the development. When evaluating the feasibility of a project, the land cost is most relevant when it is an actual acquisition price or is based on the “as is” market value of the site.
Pre-Opening and Working Capital
Operating reserves, pre-opening, and marketing costs are important items to include in development budgets. Sometimes these costs are omitted from the budgets that we review and are amortized in the profit and loss statements instead. It is critical to acknowledge these costs as part of the potential feasibility of a new hotel.
Our hotel development cost categories are not meant to be all-encompassing but to reflect the typical items in a development budget. In construction accounting, development budgets are generally presented in far greater detail than for general investment analysis. For the purposes of considering the overall feasibility of a proposed hotel, we find our hotel development cost survey categories to cover the major components of hotel construction costs. Nonetheless, individual accounting for specific projects can still be affected by tax implications, underwriting requirements, and investment structures.
Data Collection and Sample Size
In 2018, HVS collected actual hotel construction budgets across all ten provinces in Canada. While not every construction budget was included (due to a variety of reasons, including incomplete data, skewed data, or unique development attributes), the construction budgets sampled span the country and are from 2015 to 2018. Construction costs vary greatly in different parts of the country and each development is different. In this sample, the highest development costs per key were recorded in Fort McMurray. Given the strength of this market, when these developments were underwritten as one of the top performers nationwide, the developers made a conscious decision to proceed as the performance in the market supported the investment decision at that time. Whereas in most other markets, the same development costs would have been value engineered or the project been abandoned. Not surprisingly, the next highest development costs were in major cities with strong fundamentals and high barriers to entry, such as Vancouver and Toronto. The lowest costs per room were evident for economy hotels in highway-adjacent or tertiary markets.
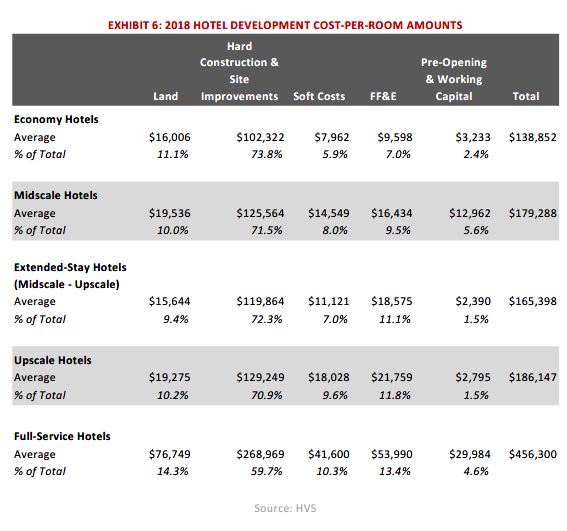
Our sample, which is the basis for this year’s survey, includes more than 55 reliable budgets and actual costs produced between January 2015 and December 2018. The distribution of the sample source by provinces is broken down in further details in Exhibit 4. The top three provinces in the dataset were also the top three provinces for proposed development activity: Ontario, Alberta, and British Columbia. Exhibit 5 shows that 90% of the surveyed budgets were for branded hotels while approximately 10% were for independent hotels. As shown in Exhibit 6, our sample was well diversified in terms of chain scales, with upscale and midscale hotels having the most development activity.
We also examined the chain scale breakdown of our data set against the national data from STR. According to STR, nearly 30,000 rooms and 250 hotels are in the planning stages. Our sample is generally in line with the STR’s national figures for breakdown by chain scale, with midscale and upscale hotels being the top two segments.
Per-Room Hotel Development Costs
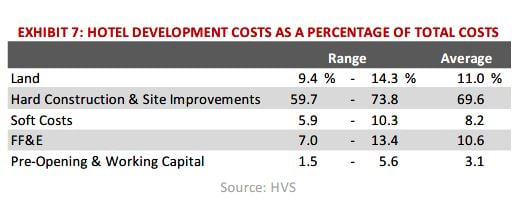
As noted previously, this is the first year HVS Canada has published a Hotel Development Cost Survey and we have included five development cost categories. The averages in Exhibit 7 reflect a broad range of development projects across Canada, including projects in areas with low barriers to entry and in higher barrier to entry markets that include urban and resort destinations.
As illustrated above, economy hotels’ average development cost per key was around $140,000, and these hotels have the lowest percentage of soft costs and FF&E out of total development cost when compared to other types of hotels in the sample. Midscale hotels as well as extended-stay hotels each demonstrated an average development cost per key of approximately $180,000 and $170,000, respectively. Upscale hotels show an average development cost per room of approximately $190,000, representing over 27% of our sample size by number of rooms.
Finally, full-service hotels established an average development cost per key at $456,300. However, it should be noted that this chain scale was the product category with the least development activity. Notably, while the land cost for most chain scales was generally near 10% of the total development costs, for full-Service hotels the cost was 14.3%. Given that these developments are generally reserved for higher barrier to entry markets and are competing for some of the best sites this is perhaps an unsurprising result.
Overall, there is a general consistency in the development cost ratios across the chain scales. In addition, FF&E costs increase when compared to economy hotels and to full-service hotels. The only exception is pre-opening and working capital. Since this cost category includes operating reserves and pre-opening recruiting, which can vary extensively from developer to developer, pre-opening and working capital categories maintain more idiosyncratic nature that varies by developer and development rather than by chain scale.
The table below outlines the range of development cost ratios by building component and the average cost across chain scales.
The lower and upper range of each of the cost categories by product types is displayed in Exhibit 8.
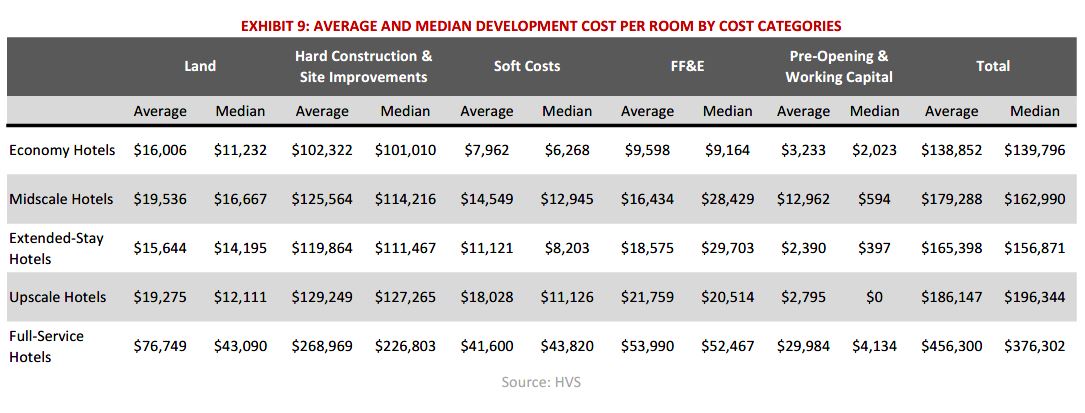
The average total development cost and median total development cost per room by are detailed in Exhibit 9. The table illustrates that most product types had a close to symmetrical data distribution with averages that were generally in keeping with the median. However, in the full-service hotel segment the average is significantly higher than the median, which indicates that the data in that segment was right-skewed with perhaps few high-cost projects pulling the average much higher than the median.
The totals for low and high ranges in each cost category do not add up to the high and low ranges of the sum of the categories. None of the data used in the survey included a project that was either all at the low range of costs or all at the high range of costs. The total costs shown in the preceding table are from per-room budgets for hotel developments and are not a sum of the individual components.
Conclusion
The budgets analyzed in this survey were provided directly by developers and owners in 2018 and reflect new hotel openings from 2015 to 2018. The survey combines the data from actual construction budgets organized across five product categories with a diverse geographic representation, various building materials, and varying chain scales.
Given the unique nature of each development, including location, quality of product, construction materials, and developer’s role in the development, costs can vary widely by project and region. Development costs are assumed to be characteristics of a typical development site and include generally applicable site preparation work and servicing. We recommend that users of the HVS Hotel Development Cost Survey consider the per-room amount in the individual cost categories only as a general guide and adjust to their local markets and conditions when considering a particular market and trying to determine a preliminary cost.
Key factors influencing development costs include: – Land – Labour (including developer or general contractor on project) – Construction Materials – Facilities/Amenity Offering – Development Cost Charges & Municipal Controls (including density) – Branding and Chain scale – Development timeline
Developers and contractors are the best sources for obtaining costs for a specific hotel project. It is also advised that developers consult more than one source in their hotel development process to more accurately grasp the true costs of development. As always, HVS remains available to assist in this process.
All individual property information used by HVS for the development cost survey was provided by owners or developers and are assumed to be reliable. Data from individual sources are not disclosed.


.JPG)
.JPG)

.JPG)
.JPG)


