By John Kelley, III, CHIA
Municipalities across the United States are seeking approvals, funding or public-private partnerships to develop or redevelop their convention centers with an attached, big-box hotel.
City councils in Kansas City and Oklahoma City are in process of getting approvals and funding secured while Portland, Oregon, and Chicago have such projects underway. One of the latest convention center hotel openings in the United States was the 600-room Hilton Cleveland Downtown, which opened on 1 May 2016.
We analyzed supply and demand of four comparable tracts before and after development of their attached convention center hotel to determine the impact on the central business district tract. The analysis focuses on aggregate supply and demand changes rather than occupancy levels. The rate of absorption affects occupancy levels and will vary in each market; therefore, only considering occupancy levels can mislead investors and municipalities.
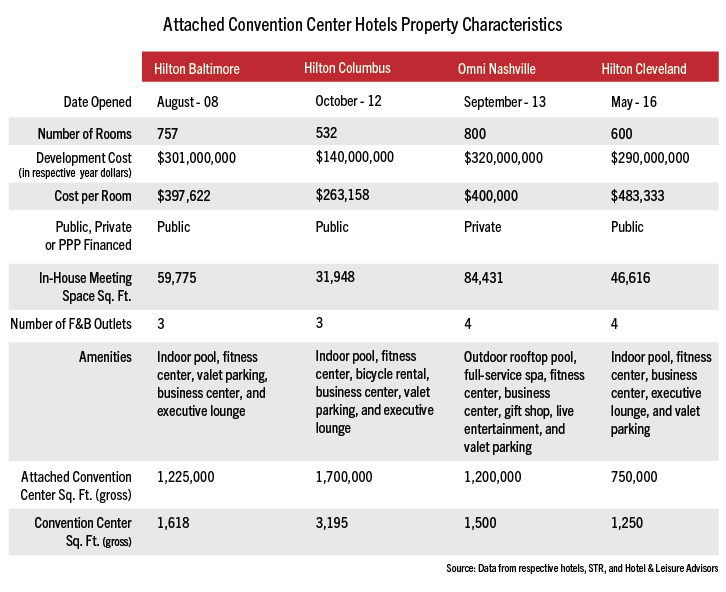
Characteristics of the four comparable properties are described in the following table:
The comparable properties were selected since they are attached convention center hotels developed within the last 10 years and their respective markets are considered comparable. Destination Cleveland, greater Cleveland’s convention visitors’ bureau, includes Baltimore; Nashville, Tennessee; and Columbus, Ohio, in its benchmark TAP reports. TAP is an industry-relevant report generated by Strategic Data Resources that provides vital strategic data for convention bureaus around the U.S. and Canada, benchmarking and measuring performance demand pace and other metrics regionally and nationally.
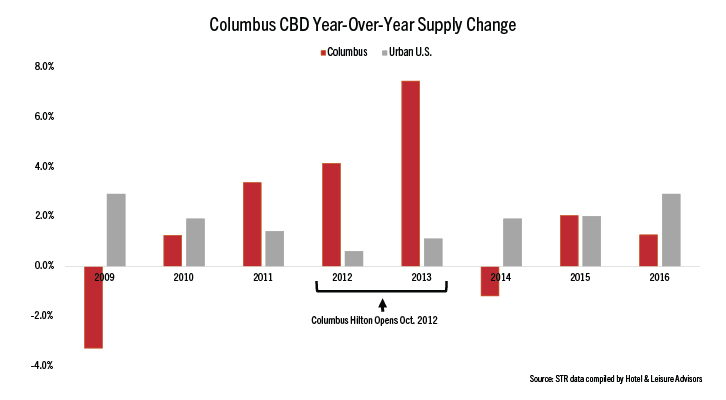
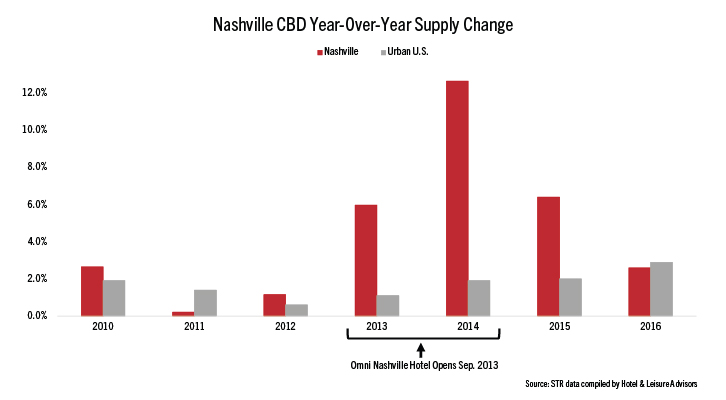
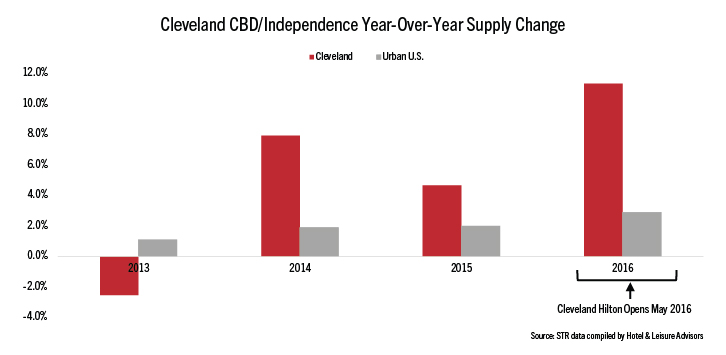
Supply analysis Year-over-year room supply percent changes for the comparable tracts and Cleveland are shown in the following graphs. Pre- and post-convention center hotel trends are highlighted and compared to the year-over-year supply changes for urban U.S. markets, according to STR. (STR is the parent company of Hotel News Now.)
Since the attached convention center hotels opened midyear, the highest supply increases were recorded the same year and the year after the properties opened. Post-convention center hotel opening data is not shown for Cleveland since its opening is so recent. Marginal supply changes occurred in each market in other years due to hotels opening, closing, and/or changing room counts after a renovation or conversion. The following table shows each tract’s compounded annual growth rate (CAGR) for supply:
The CAGR shown is for three years prior to the opening of the market’s convention center hotel and the year it opened. The four-year growth rate for Cleveland excludes the loss of 472 rooms from the Crowne Plaza downtown closing in December 2011 and reopening in May 2014 as the 484-room Westin. There had been significant interest post-recession to develop hotels, especially in urban markets, due to:
- Low interest rates enticing developers to seek higher yield investments;
- capital markets improving, which provides financing to developers; and
- demand growth outpacing new supply due to many hotel projects placed on hold or canceled during the recession, which resulted in markets becoming attractive for development.
The outpacing of demand over supply is a national trend recently slowed or reversed due to markets reaching a state of equilibrium after several years of an imbalance.
Demand analysis In theory, attached convention center hotels seek to induce demand, specifically group demand, rather than siphon existing demand from established hotels.
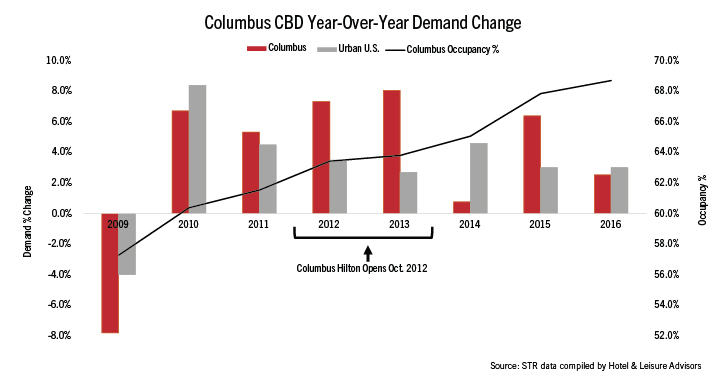
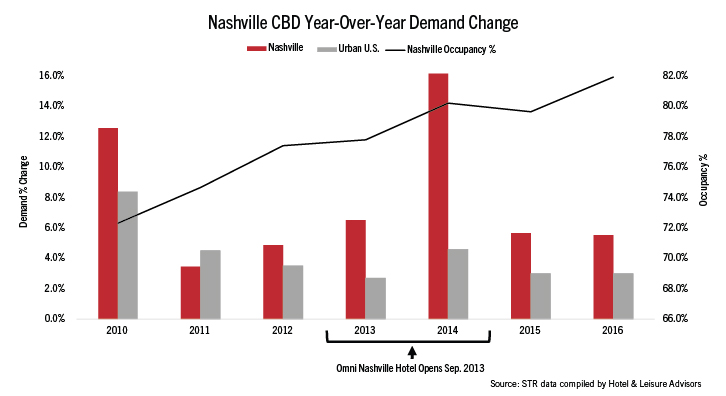
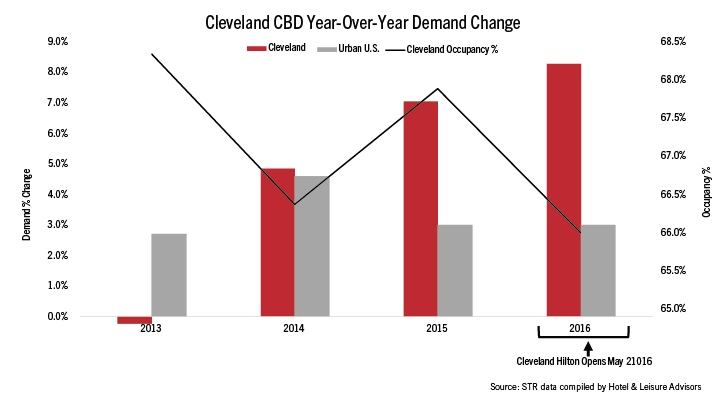
The following graphs show year-over-year demand percentage changes for each comparable tract compared to the year-over-year demand changes for urban U.S. markets, according to STR. Additionally, the comparable tracts’ occupancy levels are overlaid to illustrate how a decline in occupancy does not always constitute a decline in demand.
Baltimore’s 757-room convention center hotel opened during the worst economic recession since the Great Depression. However, Baltimore’s CBD demand grew when other markets experienced sharp declines, which can be attributed to induced group demand from the attached convention center hotel. Despite the tract’s occupancy declining during some periods, demand continued to increase.
Columbus and Nashville CBD tracts experienced similar demand increases the year of and year following the opening of their convention center hotels. Since many large-scale conventions and conferences select destinations three to five years out, it’s important to consider how these groups affect demand in the short and long term. The initial increase in demand is usually a result of group business booked a few years prior to the planned hotel, regional conferences that have shorter booking windows and accommodating demand on fill nights—a night when hotels in the tract sell out, resulting in demand being compressed to hotels outside of the tract.
Cleveland’s CBD/Independence tract had significant growth in 2016, a year that is considered an anomaly because the city hosted the Republican National Convention, the Cleveland Cavaliers won the NBA championship, and the Cleveland Indians played through Game 7 in the World Series. Despite these demand generators, the tract’s demand was up 2.4% between January and April 2017 compared to the same period last year.
The following table presents the comparable tracts’ CAGR from the year the attached convention center hotels open and the years following. Cleveland is excluded since its convention center hotel opened last year.
Nashville achieved significant demand growth between 2013 and 2016, and the market continues to benefit from its brand and ability to accommodate large-scale conferences. Baltimore and Columbus CBD tracts achieved demand increases that were closely in line with national averages over their respective periods.
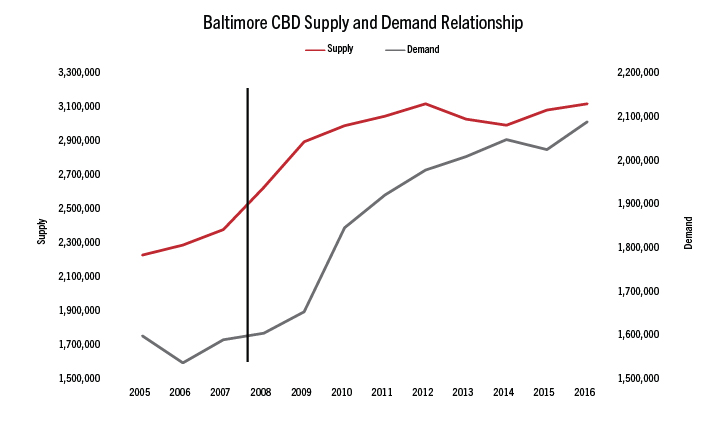
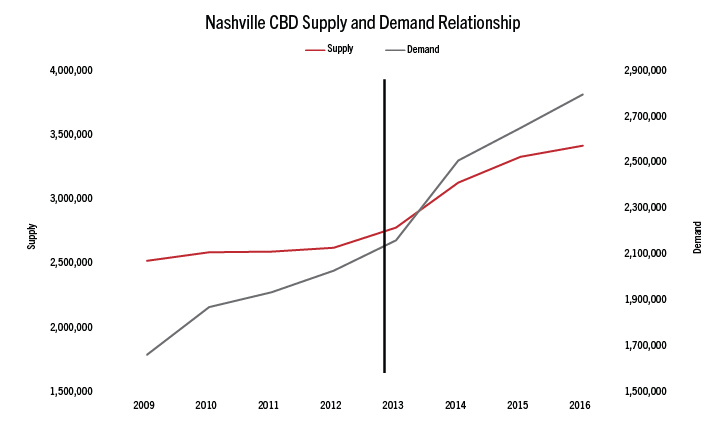
Supply and demand relationship The following graphs illustrate the relationship between supply and demand in the comparable tracts’ CBDs. The black vertical line indicates the year the attached convention center hotel opened.
The previous graphs are meant to illustrate how the opening of the convention center hotel affected the markets’ supply and demand curves. Despite the markets recording a large increase in rooms supply, demand also grew. Occupancies fluctuated during these periods but demand generally increased year over year.
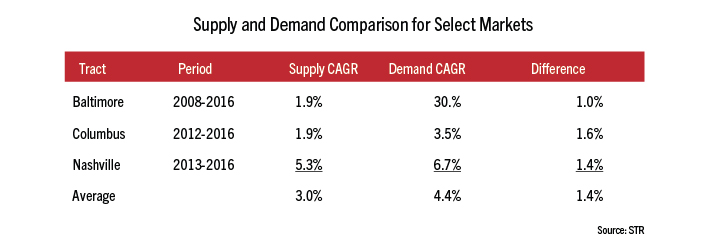
The following table shows the comparable tracts’ CAGR for supply and demand, and shows the net difference. A positive percentage difference indicates an increase in market occupancy while a negative percentage would indicate a decline in market occupancy.
Compounded annual demand growth exceeded supply growth over the periods analyzed in each comparable tract. This translates to an increase in market occupancy despite the increase in rooms supply. We note the periods shown provided each comparable market time to absorb new supply. Analysis of a shorter period could show a negative difference, which indicates a decline in occupancy.
Conclusion We project the Cleveland CBD/Independence market will record a decline in occupancy in 2017 due to supply outpacing demand; however, our analysis shows the market has potential for the demand and supply curve to reverse, resulting in higher occupancy, in a couple of years.
We also project the Hilton Cleveland will induce demand as did the comparable markets. This effect on demand could be similar to other markets that develop a competently managed and marketed convention center hotel. However, each market’s rate of growth will vary based on numerous factors.


