By Robert Mandelbaum
To project changes in profits we obviously need to look at the expected relative changes in revenues and expenses. Profit growth can only be realized when the dollar value of the change in revenue exceeds the dollar value of the change in expenses.
Within the lodging industry, there are other metrics that have historically been reliable indicators to measure the potential for hotel profit growth. One is the change in rooms revenue, or RevPAR. Using data from our annual Trends® in the Hotel Industry, we find an 86 percent correlation between annual changes in RevPAR and Gross Operating Profit (GOP) from 1960 to 2016. This implies that changes in RevPAR do provide a very strong indication of changes in GOP.
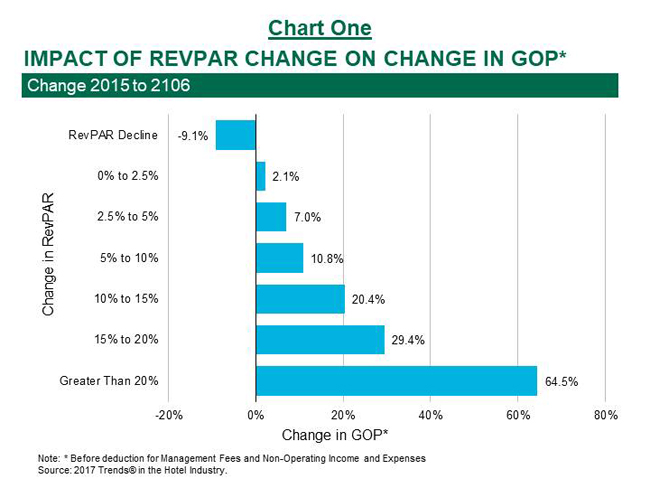
The strong relationship between changes in RevPAR and changes in GOP becomes evident when analyzing data from the 2017 Trends® report. From 2015 to 2016, the entire sample of 3,331 operating statements averaged a RevPAR increase of 2.6 percent, while GOP for the sample grew by 3.7 percent. However, when stratifying the sample by the magnitude of RevPAR change, we see a linear relationship between RevPAR change and GOP change (see Chart One).
The Composition of RevPAR
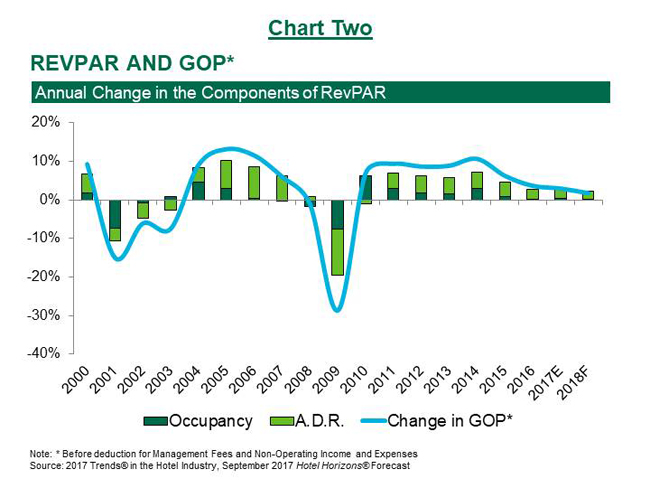
Changes in RevPAR are dictated by the relative increases and decreases of occupancy and average daily rate (ADR). As shown in Chart Two, hotel RevPAR growth typically is dominated by occupancy gains during the early stages of an industry recovery. Conversely, as industry performance approaches the top of the business cycle, occupancy growth slows and ADR growth drives RevPAR increases. GOP growth can occur when RevPAR gains are driven predominantly by occupancy, or by ADR.
It has long been believed that the efficiency of hotels to convert revenue to profits (flow through) is enhanced when ADR growth comprises more than half of the RevPAR gain. Conversely, GOP growth is assumed to be muted when occupancy is the main driver of RevPAR. This theory is based on the incremental variable costs associated with servicing the additional rooms that are rented as occupancy increases.
On paper, this theory seems perfectly rationale. However, in recent years, we have seen a departure from this long-held belief. Econometrically, we estimated an equation to explain the 2016 change in GOP from changes in occupancy and ADR. The following equation shows that the influence of the changes in occupancy resulted in a coefficient of 1.9, while the changes in ADR lead to a coefficient of 1.8. The closeness of the coefficients can be interpreted as an indication that the influences of changes in both occupancy and ADR on movements in GOP are almost equivalent. The same analysis performed in 2013 yielded similar results.
GOP Change = -0.01 + 1.9*(Occupancy Change) + 1.8*(ADR Change)
The Optimal Mix in 2016
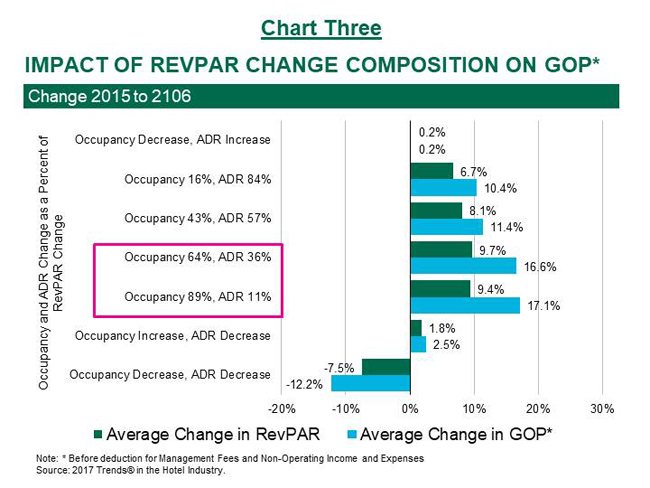
When stratifying the 2017 Trends® sample based on the RevPAR contribution mix of occupancy and ADR changes, the results confirm the recent diversion from long-standing thumb rule (see Chart Three). Among the four categories where the hotels achieved increases in both occupancy and ADR, the GOP increase was greatest when occupancy contributed to more than 50 percent of the RevPAR growth. In addition, GOP growth was greater at hotels that achieved an occupancy increase and ADR decrease, compared to those properties that saw their ADR rise, but occupancy decline.
The recent departure from historical beliefs can be partially explained by the following factors:
- Since 2012, the national inflation rate has been less than 2.0 percent. In a low inflation environment, hotels are not penalized as much for the incremental variable expenses associated with rising occupancy.
- Contemporary revenue management systems analyze the complete profitability of potential sources of demand. This includes the other revenues generated by a piece of business, not just the rooms revenue.
Implications For 2018
According to the September 2017 edition of Hotel Horizons®, CBRE Hotels’ Americas Research is forecasting U.S. hotel occupancy to increase by 0.1 percent, along with a 2.3 percent rise in ADR during 2018. The net result is a RevPAR growth rate of 2.4 percent.
Given the modest outlook for revenue growth, concurrent with the upward pressure on labor costs, hotel owners and operators are already concerned about their ability to increase profits. Unfortunately, the solace historically gained from the knowledge that revenue growth will be driven by ADR does not appear to be available as a comforting factor.