By Thomas A. Hazinski & Joseph Hansel
HVS modeled the anticipated RevPAR declines during the COVID-19 pandemic. Based on patterns of recovery following the two most recent recessions, we projected the lodging tax revenues of 24 urban markets in the United States. Comparing these projections to a baseline scenario without the pandemic, HVS estimates combined losses of 24 major U.S. markets could range from $4.0 to $5.5 billion of lodging tax revenues. Lodging tax losses of this magnitude will force bondholders, destination marketing organizations, and other stakeholders to consider steps such as debt refinancing or seeking alternative revenue streams until the hospitality industry recovers from this pandemic.
Introduction
Lodging taxes provide a critical source of support for the convention and tourism industries. Lodging tax revenues fund debt service for the construction of convention centers, arenas, and other public assembly facilities. This revenue source provides a large share of the funding for destination marketing organizations (“DMOs”) and covers the operating deficits of convention center venues. Many communities also rely on lodging taxes for support of the arts, tourism promotion, and other governmental operations. The COVID-19 pandemic has dealt a bigger blow to this crucial revenue stream than any previous event of economic dislocation in U.S. history. HVS set out to quantify this impact, so that our clients in the hospitality and tourism industries can begin to address the issue and shore up their financial positions. It is essential to know the magnitude of the problem if we are going to solve it.
The COVID-19 pandemic will have two types of impact on the lodging industry. First are the draconian travel restrictions that have been necessary to save human lives. These travel restrictions are presently being sorely felt with unprecedented cancellations of conventions and other groups events, the loss of transient lodging demand, and hotel closures. But this impact is expected to be short lived, its duration measured in months rather than years. After travel restrictions are lifted, a second impact will occur as the economy will struggle to regain its footing over the next few years. Projecting the lodging tax revenue impacts of COVID-19 is a formidable task as uncertainty reigns. Epidemiologists, public health experts, and economists hold a wide range of views on the length and depth of the social and economic dislocation.
The HVS annual Lodging Tax Study provides a starting point for our projections. HVS has gathered information on lodging tax revenue collections across U.S. cities. We combined that information with our projections of the performance hotel markets in 24 major U.S. cities. In this report we provide best- and worst-case forecasts of lodging tax revenue from 2020 through 2025. We compared our forecast to a hypothetical base case which reflects a world without the pandemic. We estimate that over the next six years, the combined losses of 24 major U.S. markets could range from $4.0 to $5.5 billion of lodging tax revenues.
Historical Precedents
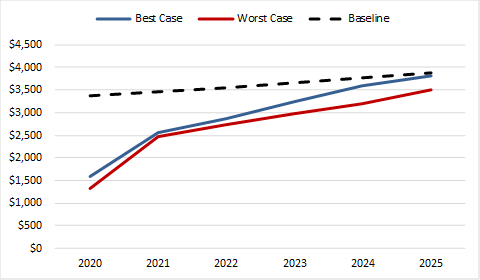
In a base-case scenario without the pandemic, and based on STR estimates of revenue growth, HVS projects that these 24 markets would have generated nearly $3.37 billion in lodging tax revenues this year.
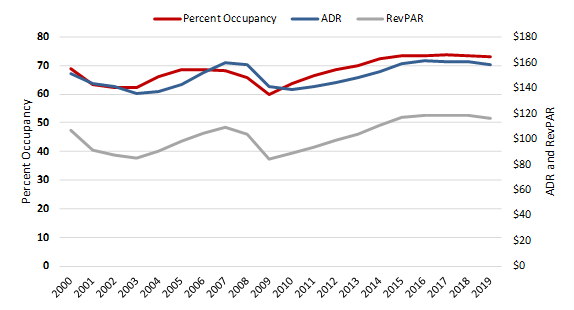
The performance of the 24 markets during prior economic shocks, provides an indication of how the recovery from the COVID-19 pandemic may play out. The figure below shows the average daily room rate (“ADR”), occupancy rate, and revenue per available room (“RevPAR”) for the major U.S. markets from 2000 to 2019.
RevPAR, the product of average daily room rate and occupancy rate is a standard industry metric that combines the effects of occupancy and average daily room rate changes on hotel revenue performance. Hotel markets show a high degree of volatility during economic downturns, with sudden decreases and gradual recoveries. For example, RevPAR (adjusted for inflation ) in the U.S. urban markets reached a low point of $83.98 in 2009 during the Great Recession but exceeded pre-recession levels by reaching $110.40 in 2014, a five-year recovery period.
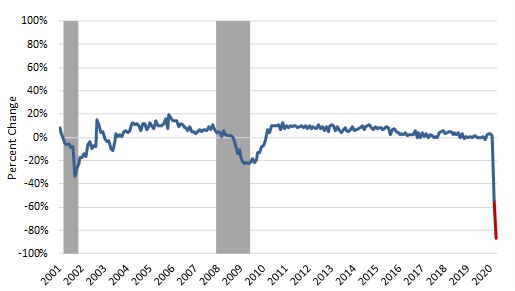
The monthly percent change in RevPAR from the prior year for the U.S. urban markets shown in the figure below demonstrates the patterns of recovery in the aftermath of the 2001 recession and the 2008-09 economic crisis.
Monthly Change in RevPAR From Prior Year (Urban Markets)
The recovery from the 2001 recession appears V-shaped, a relatively fast rebound from the nadir of the recession. The recovery from the Great Recession was U-shaped, as RevPARs continued to decline at a constant rate for many months before the recovery began. Year-to-date data on the weekly performance of the major urban U.S. markets shows an unprecedent percentage drop in RevPAR. HVS projects that if the current weekly level of RevPARs continue throughout April, RevPARs will reach to $15.61 from a pre-crisis level of $116.97—an 86.7% decline from the prior year.
Whether any and which of these historical precedents applies to the current situation depends on the path of economic recovery. When asked to compare the fallout of the current pandemic crisis to the Great Depression, Harvard economist Kenneth Rogoff said, “The real big question is how far we’ll come back. All the things being done are extremely important and this will be won or lost on the health front. On the peak-trough, the U.S. probably won’t hit Great Depression levels. But if you look at the world [economy]— on the depth of this downturn—there is a good chance it will look as bad as anything over the last century and half. If we are back to 95% of normal in two years, it will be a lot better than the Depression.[1] Bill Gates who has been studying and lecturing on pandemics for the past several years, predicted that things won’t “go back to truly normal until we have a vaccine that we’ve gotten out to basically the entire world.[2]
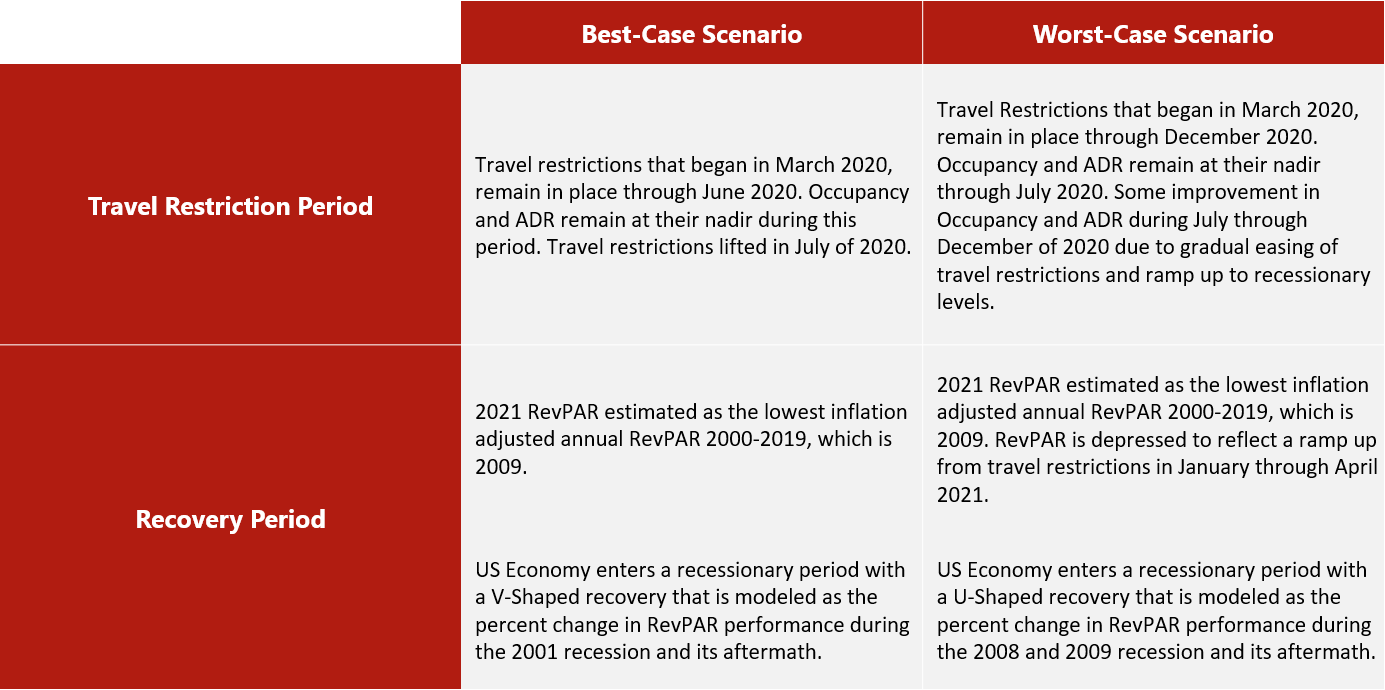
To address the uncertainty surrounding the length of travel restrictions and the path of recovery, HVS forecasted lodging taxes under two scenarios. The best-case scenario reflects a V-shaped recovery like the aftermath of the 2001 recession. The worst-case scenario reflects a U-shaped recovery like the aftermath of the Great Recession. We also varied the length of the immediate impact of travel restrictions in each scenario. In the best case, HVS assumes that travel restrictions are lifted by the summer of 2020 and in the worst case, travel restrictions remain in place until the end of the year. The table below describes the assumptions for the two scenarios.
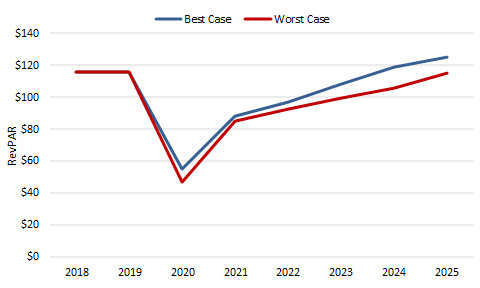
IIn the best case, RevPARs recover from the 2020 nadir in three and a half years. In the worst-case scenario, the depth of the decline in 2020 is more severe and full recovery would likely occur in 2025. In prior recessions, HVS has observed that recovery of room night demand differs by market segment. Essential business travel is the first to recover followed by transient leisure travel. The recovery of group meeting business lags the other segments because these events have long term planning horizons and corporate spending on group events is depressed during periods of economic distress.
The sudden and massive shift to online meetings has already provided a substitute for group travel. Some use of electronic meetings may persist after travel restrictions are lifted, but eventually group travel will recover. The desire for face-to-face meetings is compelling and the absence of group meetings during the current crisis has highlighted their importance to our economy and our social interactions. The cities analyzed in this report are more highly dependent on group travel than the U.S. as a whole. While recovery rates will vary greatly among cities, many urban markets may lag the recovery of the rest of the U.S. lodging market because of their dependence on group business.
Revenue Forecasts
To estimate lodging tax revenues, HVS applied the estimated RevPAR growth rates to lodging tax revenues. These RevPAR growth rates capture the combined changes in room night demand and average daily room rates. HVS also factored in hotel room supply growth. Hotel projects already under construction or in the pipeline may come online during the downturn.
The baseline scenario, a hypothetical world without the pandemic, reflects room-night demand and ADR growth of 1.9 % in 2020 and 2.3% growth in 2021 as had been projected by STR Global before the onset of the crisis. In subsequent years, HVS assumes the room-night demand would have grown at 1% per year and ADR would have grown at an average rate of 2% per year.
The following tables show the best- and worst-case forecasts of lodging tax revenues in the 24 U.S. cities analyzed in this report.
From 2020 through 2025, lodging tax revenues in the 24 major markets are estimated to fall short of the baseline by $4.0 billion in the best-case scenario and $5.5 billion in the worst-case scenario. The following chart shows the forecast of lodging tax revenues from 2020 to 2025 as compared to the baseline projection of revenues.
Conclusions
The effect of the COVID-19 pandemic on lodging tax revenue presents serious challenges to DMOs, convention centers, and other public and private agencies that are dependent on this revenue stream. The loss of revenues necessitates remedial actions on the part of federal, state, and local governments.
- Governments may need to refinance debt that is repaid by lodging tax revenues if reserves are insufficient to cover existing debt service obligations.
- Temporary closures of convention centers and reductions of DMO operations may require employee furloughs and other costs cutting measures.
- Cities need to seek replacement revenues to maintain venue operations and to provide ongoing support of their DMOs. The federal government is the only realistic source of replacement revenues because it is the only level of government that possesses the tools to generate the necessary fiscal stimulus. The revenues of state and local governments have been severely reduced and are likely to remain depressed during the recovery period.
- Convention center expansions and other public assembly venue projects may be delayed until alternative revenue sources can be found or lodging tax revenues fully recover.
But now is not the time to stop planning for future investment of lodging tax revenues in the hospitality and tourism industries. However long the recovery takes, it is a temporary situation. Cities that emerge from this crisis with a plan of action will be best positioned to take advantage of future growth.
The projections contained in this report are based on information available at the time of this writing. Given rapidly changing circumstances, actual outcomes may be materially different from these forecasts. The HVS forecasts are aggegatted for the 24 urban markets included in the study and these projections should not be applied to any single market. Further and more detailed study would be necessary to project the perfomance of any individual market.
Our knowledge of the impact of the COVID-19 pandemic on the hospitality industry will continue to evolve as more information becomes available. HVS will monitor the impact on lodging tax revenues and update our analysis as appropriate.


.png)
