By Suzanne R. Mellen
After more than five years of relative stability, new factors are at play in the hotel investment market that will affect hotel capitalization rates and values in a changing economic landscape. Hotel sales transaction activity declined in 2017, while cap rates continued to rise modestly, and hotel values held stable. The outlook for 2018, while uncertain because of the changing political and economic landscape, is more positive than a year ago due to the tax reform’s favorable treatment of commercial real estate and a more optimistic business environment. This article presents recent trends and a sensitivity analysis illustrating the potential impact of these forces.
It’s hard to ignore the changes afoot in the U.S. political and economic landscape. While the impact of deregulation, anti-immigration activity, and the Tax Cut and Job Creation Act of 2017 (TCJA) have yet to be felt or measured, the lodging industry is operating on a platform of shifting sands. Slowing RevPAR and NOI growth, coupled with rising interest rates, further cloud the outlook. Only time will tell how our industry will fare, but the pros and cons can be weighed in the interim to assess the potential impact on hotel cap rates and values.
Hotel sales transaction activity provides a gauge for assessing asset value and cap-rate trends. While total 2017 U.S. hotel sales volume (based on preliminary data reported by Real Capital Analytics) reached $27 billion,[1] a decline of 25.0% from the $36 billion level reached in 2016, individual sales transactions, which accounted for 82.0% or $22.2 billion of the total volume, declined by only 2.3%. Approximately $8 billion of the decline in transaction sales volume was due to significant declines in portfolio and entity transactions,[2] which in turn were dominated by Chinese investment in 2016. Portfolio and entity volume declined by 25.0% and 87.0%, respectively. Cross-border transaction activity, as tracked by RCA, declined by 69.0%, from $11.6 billion to $3.6 billion; almost the entire $8-billion decline in offshore activity can be attributed to a pullback by Chinese investors.
The average price per key (PPK) derived from the total sales volume increased by 3% in 2017, from $134,000 to $138,000. Major hotel sales volume, defined as those that sold for a price of $10 million and over, declined by 29%, and the average PPK held steady at $222,000 per room. Sales volume of assets priced at $10 million and under remained stable, as did the average PPK. The lower average PPK should not be viewed as a decline in hotel values, as this metric is affected by the composition of assets sold. Fewer large, high-priced hotels in coastal metro areas sold in 2016 and 2017, thus affecting the PPK; secondary markets with more potential for upside were favored by investsors. In summary, the hotel transaction market was active and steady in 2017, despite the concerns and pullout of some investors.
2017 Hotel Sales Transactions $2.5+ and $10.0 + Million
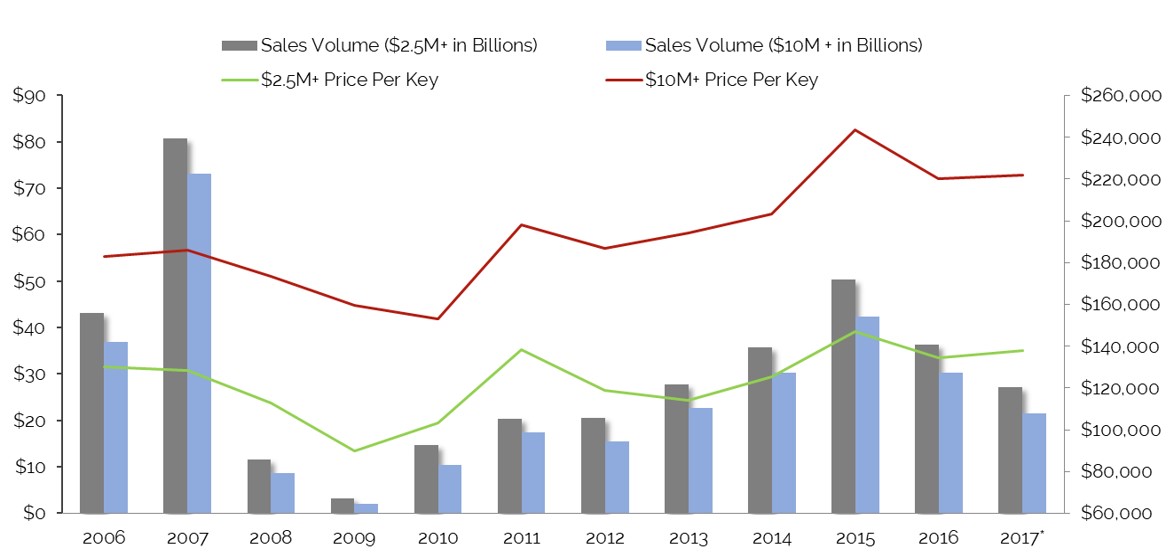
As evidenced by the following data, individual hotel sales volume reached a consistent level of $22–23 billion in 2014, 2016, and 2017. The heady $29.6 billion individual sales volume in 2015 was driven by a number of large, high-priced individual transactions in major metro areas. Overall, the hotel transaction market has remained active and balanced, reflecting the continued appeal of hotel assets for yield-driven investors.
2017 Hotel Sales Volume: Individual Asset, Portfolio, and Entity

While individual asset transaction volume has remained steady, capitalization rates continued their modest year-over-year rise because of lower future RevPAR and NOI (net operating income) growth exceptions. According to HVS data derived from hotels appraised at the time of sale, overall capitalization rates based on historical NOI rose over the course of 2017, averaging 7.5% for full-service hotels based on historical NOI. Note that these are averages and rates of return can vary significantly for individual assets.
Full-Service Capitalization and Discount Rates Derived from Sales Transactions
This same data are reflected in the following graph. Cap rates continued their modest climb through 2017, while discount rates flattened given the slowing of NOI growth.
Full-Service Capitalization and Discount Rates Derived from Sales Transactions
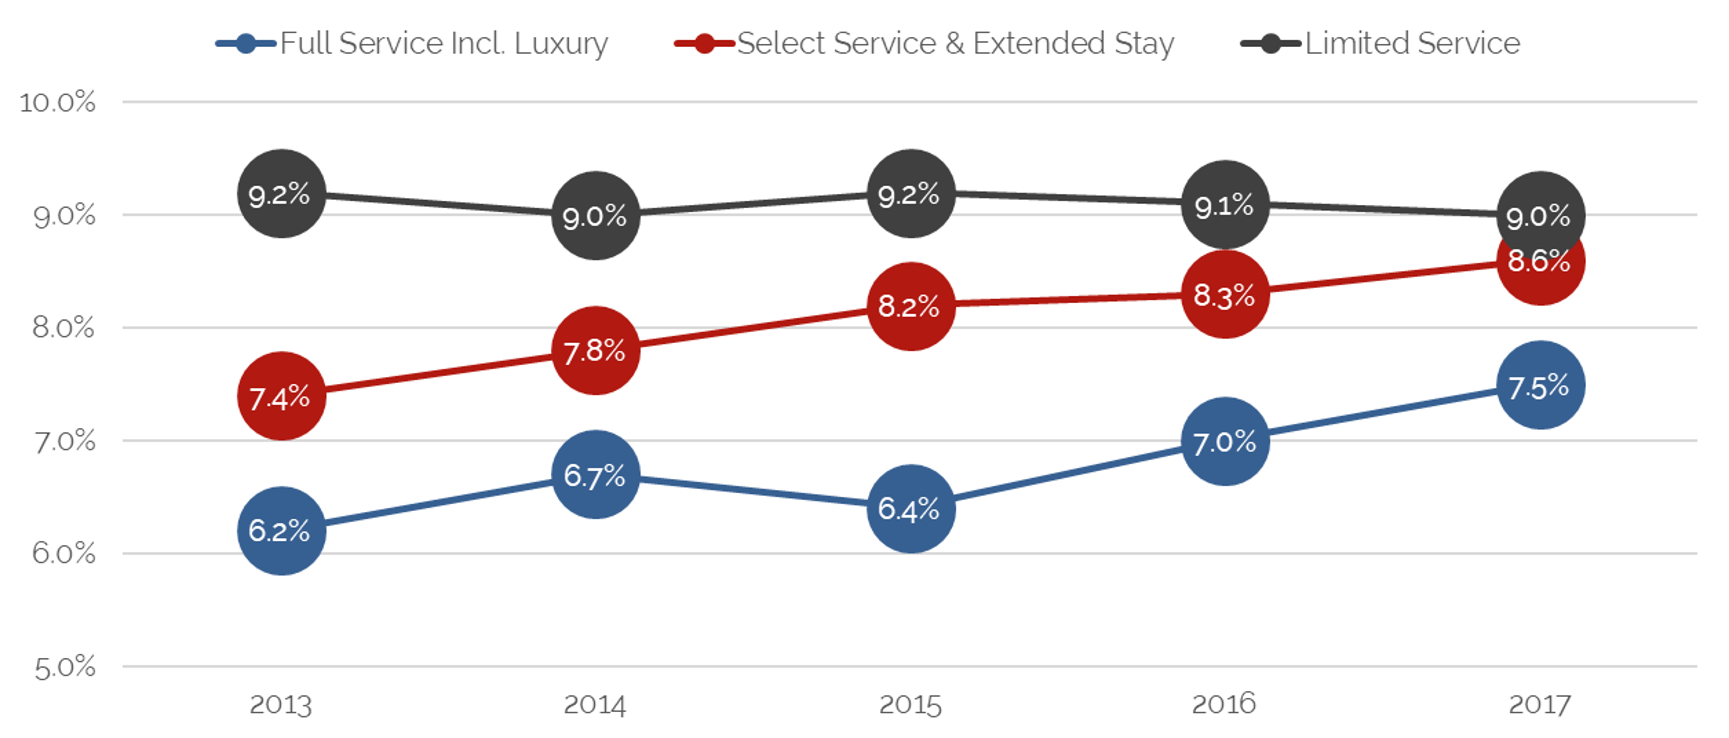
Cap-rate data based on historical NOI, captured by HVS for full-service, select-service/extended-stay, and limited-service hotels over the past five years, are presented below. Select-service and extended-stay hotels reflect the branded, upscale STR chain scale, while limited-service hotels reflect the midscale and economy chain scales. Cap rates for full-service hotels rose 30 basis points (bps), while select-service/extended-stay rates increased 10 bps. Limited-service hotel cap rates remained stable.
Comparative Average Cap Rates Derived from Sales Based on Historical NOI
We caution that the derived capitalization rate data are dependent upon the individual sales transactions that comprise the data. The wide range in cap rates that comprise the HVS data averages is evidenced in the chart below. Individual sales transactions can affect the cap-rate range and average.
Capitalization Rates Derived from Sales Transactions – Historical NOI
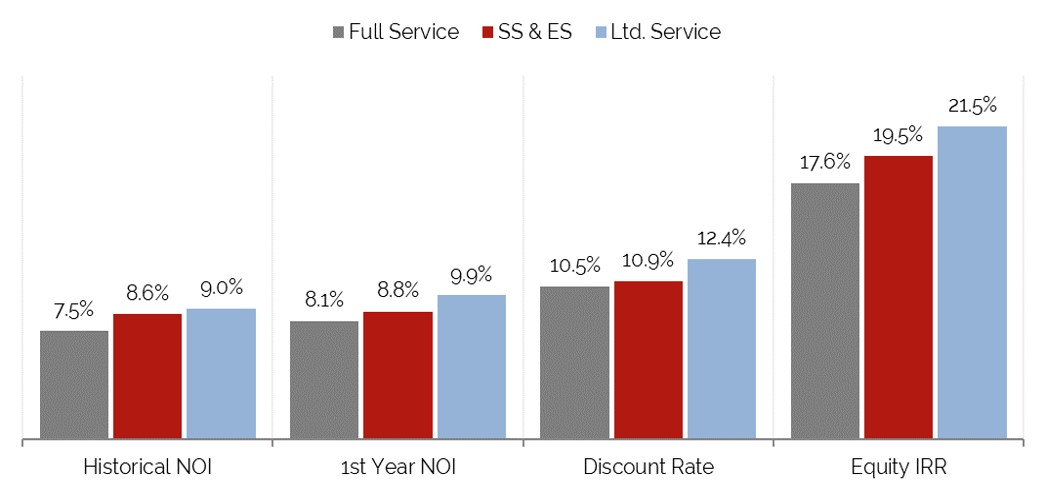
The following chart, which sets forth capitalization rates and internal rate of returns (IRRs) by product segment for 2016, reflects the step-up in rates of return from the full-service to select-service/extended-stay and limited-service sectors. “Going-in” capitalization rates, derived from projected first-year NOI divided by the purchase price, range from 20 to 90 bps above cap rates derived based on historical NOI, reflecting the expectation of future increases in NOI by investors.
Average Rates of Return Derived from 2017 Sales Transactions[3]
As we assess the outlook for hotel values and cap rates, key factors that will affect the hotel investment landscape over the near and mid-term include the following:
1) The Tax Cut and Jobs Act (TCJA) of 2017, as commercial property owners are some of the biggest beneficiaries of the new law
- The 1031 Exchange provision remains in place.
- Commercial property owners will still be able to fully deduct mortgage interest expense, while also benefitting from the reduced 21.0% corporate tax rate.
- Pass-through entities, like LLCs and partnerships, commonly used to own commercial real estate, will benefit from lower tax rates; they will be taxed at their personal tax rate, less 20.0% for expenses.
- The TCJA allows full and immediate expensing of short-lived capital investments for five years.
- The net effect of this favorable tax treatment is likely renewed interest in commercial real estate ownership and development. Strong demand for real estate assets is likely to positively affect hotel values.
2) The TCJA’s significant reduction in corporate taxes, increasing cash flow for corporations
- With increased cash flow, companies may loosen their purse strings on corporate and group meeting travel.
- Companies are already sharing their higher profits with employees to some degree, which will enhance consumer discretionary income for travel.
- Repatriated profits may be reinvested for company growth.
3) The current administration’s pullback on federal regulations has increased optimism on the part of businesses.
- Greater capital investment in research, plants, and equipment may be stimulated, which should in turn generate stronger commerical, and even meeting and group, demand for hotels.
- Additional job growth is likely to result from increased corporate investments in growth.
4) The TCJA tax law will put more money in the pockets of many consumers over the near term. However, the limitation on SALT (state and local taxes) deductions may lead to lower earnings for high-income consumers in states with high state income taxes and home values. The net impact on consumer behavior in the travel arena should be positive.
5) Stronger economic growth and more stringent immigration policies will create an increasing strain on a labor force that is already at a low 4.1% unemployment rate. Employers already, and will have to continue to, compete for labor by offering higher wages. As labor is the highest expense of a hotel, higher wages will continue to create a drag on hotel earnings.
6) The actions and policies of the current administration have resulted in a pullback of international travel to the U.S., affecting coastal hotel markets, a trend that is likely to continue over the next few years. However, a weaker dollar should offset some of this decline and encourage U.S. residents to travel domestically.
7) Hotels are under increasing pressure to upgrade their physical plants by the brands and competitive forces; costly upgrades can extend the economic life of an asset, but may not be economically justified in some markets.
8) OTAs and Airbnb continue to disrupt the lodging industry, increasing the cost of acquiring guests and drawing guests away during peak demand periods, in turn creating a drag on ADR and NOI growth. While hotel companies and the AH & LA are forging a strong counterattack, the battle will continue.
9) The benefits of the TCJA for commercial real estate may stimulate more development, which could increase the risk of overbuilding. However, lenders remain disciplined in their financing of new construction, and rising construction costs are creating headwinds for many projects, thus slowing the pipeline.
10) The TCJA is likely to trigger higher inflation due to the economic stimulus it creates; inflation, which averaged 2.1% in 2017, is currently projected to rise 40 to 50 bps in 2018. Moderately higher inflation can be good for hotels if it translates to higher room rates.
11) The larger deficit created by the TCJA, combined with a reduction in Treasury bill (T-bill) purchases by the Fed and other countries, is anticipated to lead to higher interest rates, which may affect hotel values. The federal funds rate now stands at 1.5%; the Fed plans to raise the federal funds rate three more times in 2018 if the economy continues to show strength. If growth surges, the increase could be higher. So far, hotel mortgage interest rates have sustained their historic low levels because of reduced spreads and a flattening of the yield curve. Commercial mortgage interest rates are expected to be somewhat volatile over the course of the year, but with a further tightening of spreads, should rise by only 50 to 75 bps.
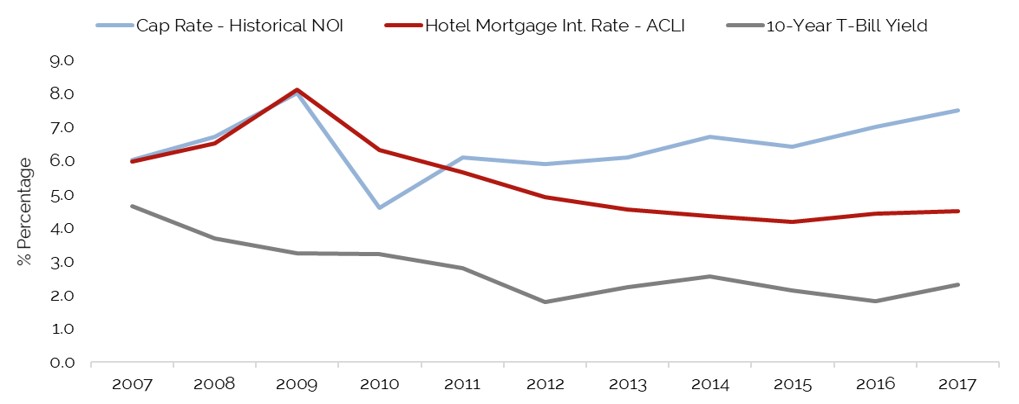
The following chart sets forth the derived capitalization rates for full-service hotels (green line), compared to the ten-year T-bill yield and hotel mortage interest rates, as reported by the American Council of Life Insurers. Cap rates, which reflect a weighted cost of capital, currently well exceed the cost of debt, allowing for an equity cushion over debt service. Hotel mortgage interest rates, as reported by the ACLI, remained stable in 2017. The spread between the hotel mortgage interest rates and the ten year T-bill tightened in 2017, helping to maintain low interest rates for hotel investors. Looking forward, the selloff of bonds has pushed up the yield on T-bills. In the wake of the tax cut package, the U.S. government will have to issue more debt in an environment where the demand for debt by the central bank, and possibly by offshore investors, is set to decline, causing an increase in interest rates.
Hotel Capitalization Rate and Mortgage Interest Rate Trends
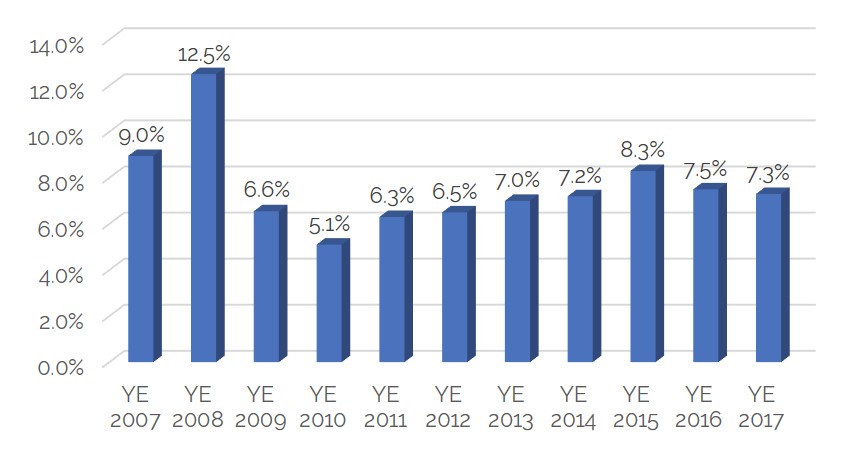
When evaluating the outlook for hotel cap rates, data derived from publicly traded REITs can provide insight into future trends. The stock market surged in 2017, with the Dow Index ending up 24.0%. In contrast to the Dow, the mean return of 19 publicly traded hotel REITs was 3.9% in 2017, following a strong 19.3% in 2016. Implied REIT cap rates, derived from investment banker bulletins and calculated as EBITDA divided by enterprise value (equity value plus debt) as of the calendar year’s end, are set forth in the following table. Implied REIT capitalization rates trended up through year-end (YE) 2015, but then declined 80 bps as of YE 2016 and another 20 bps as of YE 2017. While hotel REIT stocks did not benefit greatly from from the soaring stock market, REIT investors appear to be more optimistic in their outlook for hotel performance, providing support for the premise that the countervailing forces at work will generate renewed optimism by hotel investors. With GDP increasing by over 3% in the 2nd and 3rd quarters of 2017, and the impact of the TCJA ahead, the positive outlook appears warranted.
Capitalization Rates Derived from Select Lodging REIT Data
Outlook for Hotel Values and Cap Rates
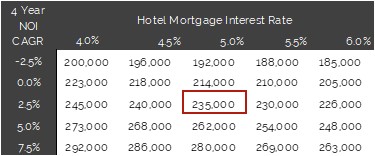
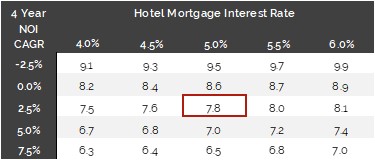
The key factors summarized in this article can be narrowed down to two major elements affecting hotel values and cap rates over the near term: changes in NOI (as driven by factors influencing operating revenue and expense) and increases in the cost of debt financing. A sensitivity analysis has been performed for a sample hotel, including varying NOI[5] growth levels and hotel mortgage interest rates to assess the potential impact of these factors. A mortgage-equity, ten-year DCF was performed assuming a 70.0% loan-to-value ratio, and an equity return requirement of 18.0%; these metrics were held constant,[6] while interest rates and NOI growth rates were varied incrementally. NOI changes were calculated as compound annual growth rates (CAGR) from the historical trailing-twelve-month (TTM) NOI to the fourth forecast year, with 3.0% increases thereafter. The resultant value per room of this sample hotel for each permutation is set forth in the chart to follow.
A baseline value of $235,000 per room has been selected under a scenario assuming a 2.5% CAGR over four years and a 5.0% interest rate.[7] If this same hotel’s NOI increases at a CAGR of 5.0% over four years, at the same 5.0% interest rate, the value would increase by 11.0% to $262,000 per room. If the interest rate rises to 6.0%, the value at the same 5.0% CAGR would increase by only 6.0%, but the higher NOI growth would more than offset the interest-rate increase. If NOI decreases by a 2.5% CAGR, the hotel’s value would decline by 21.0% to $185,000, assuming an interest rate of 6.0%.
NOI Growth and Interest Rate Impact – Hotel Value Per Room
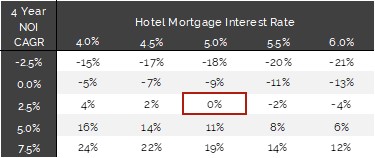
The change in value from the baseline, illustrated below, indicates that a CAGR of 2.5% per year in NOI is not enough to offset a 100-basis-point increase in interest rates; the interest-rate increase is more than offset at a 5.0% CAGR. Thus, we can conclude that the impact of rising interest rates will be modest if the economic forecasts of higher GDP growth hold true. Experts are prognosticating a RevPAR increase of roughly 50 bps over the rate of inflation in 2018, driven primarily by average rate; if operating costs hold, net income levels should continue to rise. The extent to which they do will be determined on the local market and property level. Based on this analysis, a 50- to 100-basis-point increase in interest rates will have a minor impact on values if NOI increases by 2.5%, while greater growth will more than offset the interest-rate rise.
NOI Growth and Interest Rate Impact on Baseline Value
The cap rates associated with each valuation scenario are set forth below. Higher projected NOI growth lowers the cap rates, assuming a constant interest rate, as an investor is willing to price an investment at a lower rate of return with the anticipation of stronger NOI growth going forward. Assuming a constant rate of growth, a 100-basis-point increase in the base interest rate, from 5.0% to 6.0%, increases the cap rate by 30 to 50 bps. The impact of varying NOI growth rates is more profound. At a constant 5.0% interest rate, a 2.5% CAGR decline in NOI results in a 9.5% cap rate on TTM NOI, while a +7.5% CAGR in NOI results in a 6.5% cap rate.
NOI Growth and Interest Rate Impact – Cap Rate (Historical TTM NOI)
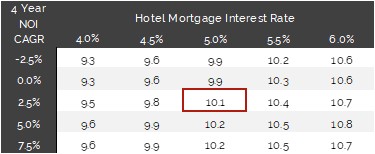
The free-and-clear discount rate resulting from each valuation scenario is presented below. The discount rate varies by 110 to 130 bps from the low to high range of interest rates, but varies by only 30 bps when interest rates are held constant and growth rates are varied. A comparison of the cap rates and discount rates reveal that the differential between these two metrics increases with greater growth, which is no surprise since a discount rate equates to a cap rate plus the rate of change.
NOI Growth and Interest Rate Impact – Discount Rate (10 Year DCF)
Conclusion The current U.S. political landscape and the policy and regulatory changes will undoubtedly alter the economic landscape in the near future. Ultimately, these shifting sands will affect the hotel investment environment, as well. Taking the countervailing factors into consideration, higher economic growth will likely become apparent later in 2018, which will in turn result in stronger hotel performance that will facilitate new supply absorption and offset the impact of higher interest rates. Debt and equity capital for hotel investments is expected to remain widely available. Cap rates are likely to remain stable or even moderate despite higher interest rates due to the prospect of higher growth; hotel values should sustain their current levels or rise moderately, barring any unforeseen event. If the TCJA further stimulates the economy, hotel values should resume their rise, which had slowed over the past two years. As always, we caution that the value of a given hotel can only be measured by an evaluation of the specific property and local market factors affecting an asset.
[1]This dollar volume will rise marginally as additional sales data are captured and confirmed by RCA. [2]RCA defines portfolio transactions as those that comprise two or more properties. In an entity transaction, only the allocated real estate asset values are recorded in the RCA sales data; the value of company franchise and management operations are excluded. [3]Cap rate and discount rates derived from actual transactions appraised by HVS at the time of sale. [4]The factors summarized represent only a partial list of the numerous provisions of the Tax Cut and Jobs Act that will affect commercial real estate; please contact a tax professional for a complete assessment of the tax law provisions. [5]Earnings before interest, taxes, depreciation, and amortization (EBITDA) and after a 4% reserve for replacement [6]Terminal cap rates were varied by 50 bps to synchronize with the cap rate derived from the calculations. [7]If a different baseline scenario is selected, the impact on value of varying NOI growth rates and interest rates can be calculated as the % change between the respective values per room in the table.


