By Robert Mandelbaum
Historically, revenue management within the lodging industry has focused on renting guest rooms in a profitable fashion. Revenue managers, aided by sophisticated computer programs, helped hotels determine the proper balance between the volume of guest rooms rented, with the price charged to rent those rooms. These decisions are now made round the clock, with room prices on any given day changing by the hour.
As revenue management has evolved, other factors have been added to the equation. Now, it is not just rooms revenue that is evaluated. Hotels realize that an occupied room has the ability to generate other revenues within the property. Hotel guests order room service, grab a cocktail in the lounge, or attend the black tie banquet on the concluding night of their convention. They park their cars in the garage, and then get a massage in the spa. They also take advantage of on-site concessions such as car rental booths and gift shops. Per the 11th edition of the Uniform System of Accounts for the Lodging Industry (USALI), the revenue from these other sources are grouped into three categories on a hotel's operating statement; food and beverage, other operated departments, and miscellaneous income.
Each year CBRE Hotels' Americas Research collects hotel operating statements from thousands of hotels across the United States that volunteer to participate in our survey. The results of the survey are presented in the firm's annual Trends® in the Hotel Industry report. The first edition of the Trends® report was published by Pannell Kerr Forster (PKF), the predecessor firm of CBRE Hotels' Americas Research. Using data from the Trends® survey we are able to analyze historical changes in all revenues earned by U.S. hotels.
Composition of Total Revenue From 1977 through 2015, total hotel revenue for the hotels that have participated in the Trends® survey increased at a compound annual growth rate (CAGR) of 4.2 percent. Three of the revenue sources exceeded the total revenue growth rate during this period. They are rooms revenue (4.8%), other operated revenue (5.5%), and Miscellaneous Income (4.9%). The lone source of revenue that lagged was food and beverage (3.1%).
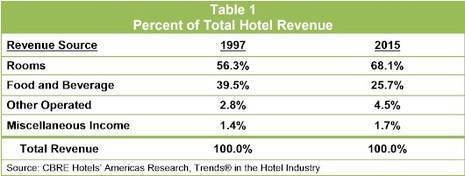
Given the relative CAGR rates for the different revenue sources, the composition of total hotel revenue has changed significantly from 1977 to 2015, and depicts how the industry has evolved during this time period. Table 1 compares the total hotel revenue mix in 1977 to the mix in 2015.
Per the 11th edition of the USALI, total revenue changed to total operating revenue in 2015. Total operating revenue includes sales from the rooms, food and beverage, other operated and miscellaneous income departments. However, in 2015, it excludes non-operating income.
As noted in Table 1, total revenue for the properties in our Trends® sample has shifted dramatically towards the income received from the rental of guest rooms. This is representative of the proliferation of limited and select service properties during this time period. At these types of hotels over 90 percent of revenue comes from the rooms department. Further, recent changes to guest preferences have reduced the amount of money guests spend in hotel restaurants. This trend will be discussed later in this article.
Rooms Revenue From 1977 to 2015, rooms revenue averaged an annual growth rate 4.5 percent at the properties in our Trends® sample. Growth in rooms revenue can occur by renting more guest rooms than the prior year, raising room rates, or a combination of both. During the 38 year period, the CAGR for occupancy was 0.2 percent, while average daily room rates (ADR) grew at an average annual pace of 4.3 percent. Even after accounting for inflation, the 0.5 percent real CAGR for room rates is greater than the 0.2 percent contribution from renting more rooms.
Prior analysis performed by CBRE Hotels' Americas Research found that changes in ADR have a greater influence on changes in hotel profits than changes in occupancy. Accordingly, the enhancements to yield management practices that emphasize ADR growth over changes in occupancy can partially explain the relative changes in occupancy and ADR the past 38 years.
Enhanced emphasis on ADR growth, plus the shift towards a greater contribution of rooms revenue, has resulted in significant enhancements to the profitability of the average hotel in the Trends® sample. Gross Operating Profit (GOP) measured as a percent of total revenue increased from 30.5 percent in 1977 to 37.5 percent in 2015.
Food and Beverage Revenue Not only have changes in the composition of the lodging inventory and management practices influenced the transformation of the mix in hotel revenues, so to have changes in consumer preferences. This is extremely evident when analyzing the changes in hotel food and beverage revenue during the latest business cycle – 2007 through 2015.
In 2015, total food and beverage revenue for the full-service properties in our sample finally surpassed the pre-recession levels earned in 2007. However, over the eight year period, food and beverage revenue growth has been limited to just 4.7 percent.
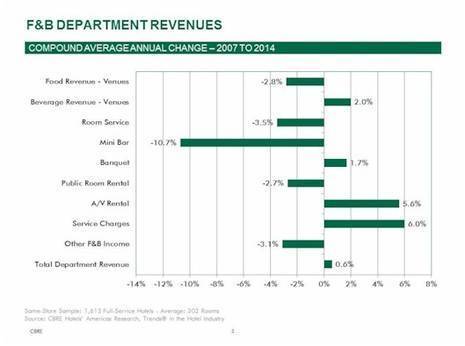
Prior to the 2009 industry recession, food sales in hotel restaurants and lounges averaged over one quarter (27.6%) of total food and beverage department revenue. In 2015, revenue from this source dropped to 20.9 percent. Concurrently, room service and mini-bar revenues have also declined as a percent of total department revenue and in dollar values. These downward shifts in revenue contribution (and total dollars) are indicative of guests' preferences towards more communal and casual dining and social experiences. Many full service hotels have reduced the hours of operations of their restaurants, or closed them entirely. Instead, they have developed informal coffee shop and grab-and-go style venues in their lobbies.
As a replacement for the loss in food venue revenue, a greater emphasis has been placed on food and beverage revenue related to meetings and banquets. In 2015, revenue from such sources as banquets, audio/visual, and service charges are all greater than they were in 2007. The rise in these revenues can be attributed to the increased solicitation of local events, as well as the return of group demand. While increasing rooms revenue by raising room rates may be the preferred tactic, increases in occupancy driven by a greater share of group demand does bring with it increases in revenue for the food and beverage department.
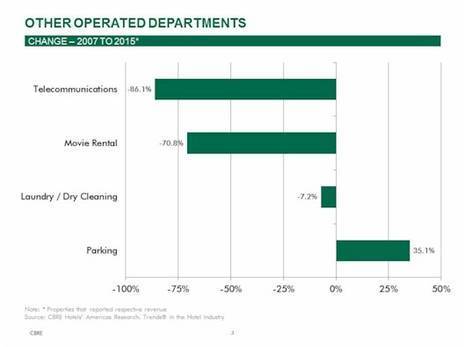
Other Operated Departments When analyzing changes in other operated department revenues, the influence of technology becomes evident. From 2007 to 2015, the revenue hotels received from the guest use of telephones has declined by 86.1 percent, or 21.9 percent on a CAGR basis. This decline the telecommunications revenue actually began back in 2001. Clearly the use of cell phones has rendered the in-room telephone virtually useless as a source of revenue. Given the constant and precipitous decline over the past several years, the USALI has re-categorized telecommunications from a discrete operated department to a minor other operated department.
The increase in portable technology has also had an impact on hotel revenue. Given the high cost of renting a movie, combined with the portability of entertainment sources such as Hulu, Amazon Prime, and Netflix, fewer guests are renting movies and games via the guest room television. From 2007 through 2015, hotel movie rental revenue for the properties in the Trends® sample declined by 70.8 percent, or 14.3 percent on a CAGR basis.
Societal changes have had an impact on the use of laundry and dry cleaning services at hotels. The rise in business casual attire has contributed to a 7.2 percent decline in laundry and valet revenue (both hotel operated and out-sourced) from 2007 to 2015.
One other operated department revenue source that has increased the past few years has been parking. Relative to other operated departments, parking has a high profit margin for hotels. Therefore, during the recession, several hotels implemented parking charges in an effort to offset the loss of revenue across the hotel. Since 2007, hotel parking revenue has increased each year except 2009 when it declined by just 1.2 percent. During the past eight years, hotel parking revenue, and the accompanying profitability, has increased by 35.1 percent.
Miscellaneous Income Miscellaneous income (formerly known as rentals and other income) represents the revenues hotels receive as a commission from out-sourced service providers, or sales mandated by accounting rules to be recorded on a "net basis". Over the years, the USALI has significantly altered the types of revenue to be recorded in this category, so it is a challenge to benchmark this revenue line item from year to year. However, a look at the composition of miscellaneous income in 2015 provides some further insights into how hotels earn revenue. In total, miscellaneous income was 1.8 percent of total hotel revenue in 2015.
Hotels frequently rely on third-party companies to offer additional services to their guests. Specialty companies will lease space from the hotel to operate gift shops, car rental booths, and at times, restaurants. In 2015, the revenue earned from space rental and commissions equaled 21.1 percent of miscellaneous income. Another 5.8 percent of miscellaneous income came from commissions paid by third-party companies to the hotel for guests that utilized their services (ex. tour companies, theater tickets, attractions).
The cancellation and attrition fees collected by hotels when groups either cancel their meetings, or do not meet the quota set by their room block, are also recorded in miscellaneous income. These fees represented 14.1 percent of miscellaneous income in 2015, and are obviously more prevalent at convention hotels.
A major change made in the 11th edition of the USALI moved the recording of resort fee revenue from the rooms department to miscellaneous income. In 2015, resorts fees averaged 20.3 percent of miscellaneous revenue at the hotels in the Trends® sample. At resort hotels, this ratio can exceed 50 percent. Moving this revenue from the rooms department to miscellaneous income can also impact year to year comparisons of ADR for those hotels that are unable to recast prior year operating statements, and move the resort fees out of rooms revenue.
More Pressure for More Revenue As the U.S. lodging industry reaches the peak of the current cycle, CBRE Hotels' Americas Research is projecting a slowdown in the growth of rooms revenue for the next few years. Occupancy levels are at record high levels, thus limiting the ability of most hotels to accommodate additional guests. Concurrently, low inflation, rising levels of new supply, increased competition from Airbnb, and the empowerment of consumers by multiple third-party websites have all contributed to a muting of increases in room rates.
With room revenue growth restrained, hotel managers will be challenged to find growth from other sources of revenue. This will most likely come from a combination of increasing guest expenditures for the current amenities and services offered by hotels, or finding creative ways to monetize changes in societal, technological, and other consumer trends as they have in the past.
Reprinted from the Hotel Business Review with permission from www.HotelExecutive.com


