
WASHINGTON (February 7, 2017)—Travel weathered an abundance of challenges and continued to grow throughout 2016, according to the U.S. Travel Association's latest Travel Trends Index (TTI). The final TTI based on 2016 data shows that travel to and within the U.S. grew 2.4 percent from December 2015, while the forecast component shows that travel will continue to expand at a moderate pace in the near term.
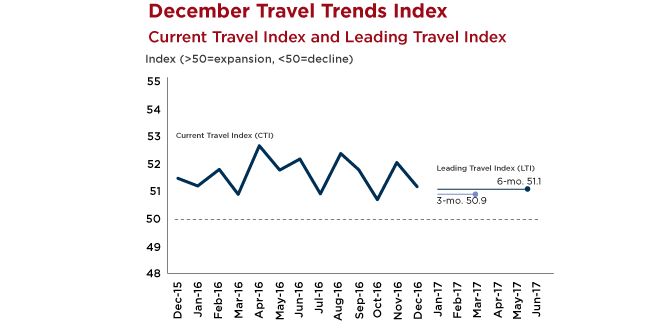
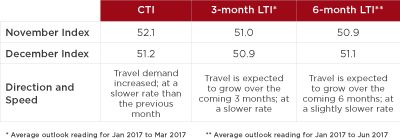
The story of the latest TTI is undoubtedly domestic business travel. Following a TTI based on November's data showing renewed strength for domestic business, buoyed by a post-election stock market surge, the sector's immediate growth declined slightly in December 2016. However, the TTI's Leading Travel Index (LTI) indicates that domestic business travel's growth rate will rebound, and catch up to that of domestic leisure travel—the sector that has long led U.S. travel growth.
The analysis and forecasts in the latest TTI are through December 2016—prior to any executive orders issued by the new Trump administration on border security and visas.
"Looking back on 2016, it is remarkable to observe the resilience of the travel industry, which is approaching its eighth straight year of expansion," said U.S. Travel Association Senior Vice President for Research David Huether.
In the full TTI report, the 6-month predictive Leading Travel Index (LTI) reading of 51.1 indicates that U.S. Travel volume is expected to grow at a rate of around two percent through June 2017.
The TTI consists of the Current Travel Index (CTI), which measures the number of person-trips involving hotel stays and/or flights each month, and the Leading Travel Index (LTI), which measures the likely average pace and direction of business and leisure travel, both domestic and international inbound. It assigns a numeric score to every travel segment it examines—domestic and international, leisure and business—in current, 3-month and 6-month predictive indicators. As with many indices similarly measuring industry performance, a score above 50 indicates growth, and a score below 50 indicates contraction.
The U.S. Travel Association developed the TTI in partnership with Oxford Economics, and draws from multiple data sources to develop these monthly readings. In order to compile both the CTI and LTI readings, the organization's research team utilizes multiple unique non-personally identifiable data sets, including:
- Advance search and bookings data from ADARA and nSight;
- Passenger enplanement data from Airlines for America (A4A);
- Airline bookings data from the Airlines Reporting Corporation (ARC); and
- Hotel room demand data from STR.
Learn more about the Travel Trends Index.
Click here to read the full report.