
By Anne R. Lloyd-Jones
Many markets in the U.S. have experienced substantial increases in inventory, with some recording year-over-year supply increases of 5.0% or more. Thus far, occupancy levels have generally remained strong, as most markets have seen demand growth keep pace with supply. The same cannot be said for average rates. The first signs of market saturation are often found in the average rate trends. Why? The short answer to this question is yield management.
Yield management is the practice of adjusting the price and availability of inventory in response to changing market conditions, including consumer preferences and demand patterns, as well as macro and micro economic trends. Yield management falls under the broader rubric of revenue management, the goal of which is to maximize revenues. Originally brought into widespread use by the airline industry, yield management has become a key strategy in the hotel industry, and most hotels either employ a revenue manager or subscribe to the revenue management services offered by their management or franchise company. For full-service hotels, a well-executed yield-management strategy includes consideration of all sources of revenues at the property (e.g., food, beverage, and meeting room revenue), not just room revenue.
Effective yield management is an ongoing process that begins with setting prices a year (or more, particularly in the case of group demand) in advance. Based on a review of historical demand patterns and current trends, the revenue manager forecasts the levels of demand for a particular night or period. The available inventory is then allocated between different segments and price points, with the goal of achieving the maximum overall average rate (ADR) for that period, at the desired occupancy level. The initial prices and allocations are revisited regularly, as rooms are booked, and changes are made in response to the volume and pace of the bookings. This process continues until the date in question, or the hotel is sold out.
In hotel terms, yield management is most commonly described in the context of strong market conditions and is one of the primary methods used to achieve year over year ADR growth. Price increases are obviously also a factor, but these are often facilitated by effective yield management. When a hotel’s yield-management strategy has resulted in a high proportion of the room inventory being sold at retail (as opposed to discounted) rates, the groundwork is laid for price increases.
Inherent in most discussions of yield management is the premise that it is an offensive strategy. This is not incorrect, in that yield management is a strategy that enables hotels to take control of their business. However, yield-management tools are not only applied in rising market conditions, and in fact are even more critical in markets that are under competitive pressure. In these circumstances, yield management becomes a defensive tool. The goal of maximizing revenues remains the same, but in the context of a stressed market, the strategy takes on a more protective posture: how to sustain occupancy without sacrificing ADR.
How Yield Management Influences Average Rate
To illustrate how yield management can influence a property’s overall ADR in both strong and stressed market conditions, we have developed an (admittedly simplistic) illustration, which is detailed below. As the goal of this example is to illustrate the shifts in ADR that can result from yield-management techniques, we have assumed that the occupancy remains the same in all scenarios. In reality, occupancy is as much a consideration as ADR, and an effective yield-management strategy considers both factors.
For the purposes of this example, we have simplified the numerous market segments into four primary categories. The retail category comprises the highest tier of rates in the transient segment, including BAR (best available rate, previously referred to as rack rate), Corporate, and Consortia. The hotel discount category includes packages, AAA rates, and other hotel- or brand-sponsored transient rate categories. These rates reflect a discount from retail levels but are typically not as discounted as online travel agency (OTA) rates, which represent the third transient category and comprise demand generated by the online travel agencies such as Expedia and Hotels.com. In this example, all group demand (meetings, conventions, tour groups, etc.) are included in the group segment; realistically, the various group subsegments are characterized by disparate rates and demand patterns and are usually considered individually.
 Source: HVS
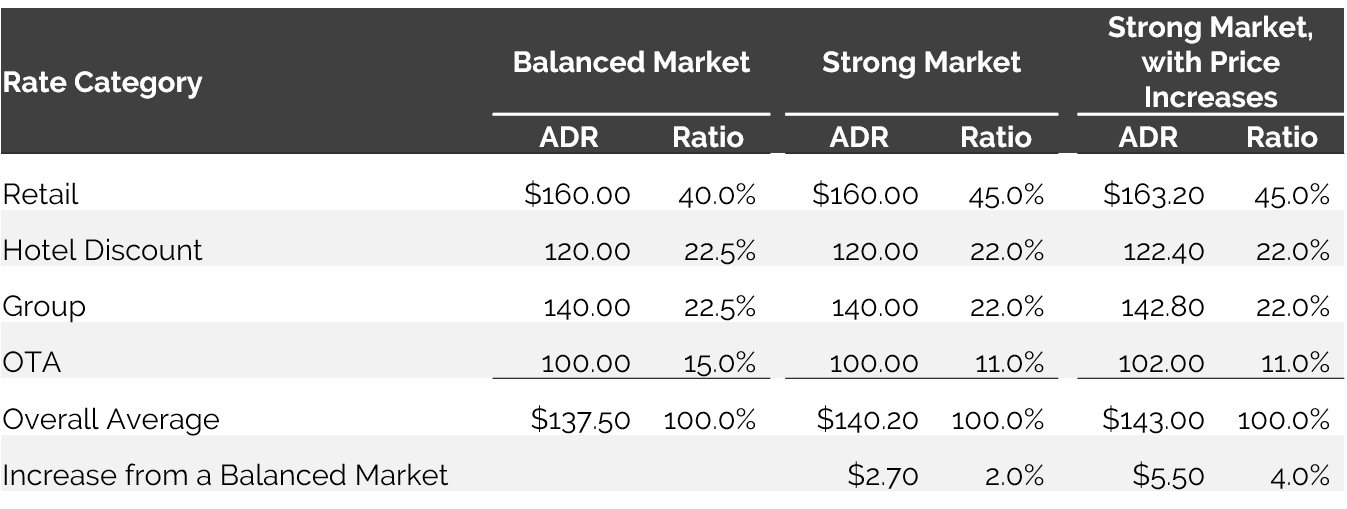
The first column illustrates the ADRs and ratios of demand for each segment in a “balanced market.” A balanced market is defined as one where supply and demand are generally at equilibrium, and revenue managers are responding to consumer and economic forces without undue competitive pressure. In this scenario, this sample hotel derives 40% of its demand from the retail segment and 15% from the OTA segment, which is used to fill the slower periods of the week and year. The remaining 45% of demand is split between the group and hotel-discount segments.
Strong Market Average Rate Dynamics
The “strong market” scenario reflects a situation wherein demand levels exceed supply. In these circumstances, the yield manager is able to increase the proportion of occupancy derived from the retail segment, thus reducing the hotel’s dependence on the other, lower-rated segments. OTAs remain a component of the occupancy, but in strong market conditions, yield managers can often manipulate demand to cover some of the softer nights of the week and year with the other segments, using minimum length-of-stay requirements, or accepting bookings that include a Sunday arrival. As a result of these strategic shifts, the strong market scenario reflects an ADR that is 2.0% higher ($2.70 in this example) than in the balanced market, without any price increases.
In addition to strategic shifts in segmentation, a strong market often also supports an increase in price. In the example above, we have assumed a 2.0% increase in all market segments. With this price increase, the overall ADR increases another $2.80, resulting in an ADR that is roughly 4.0% higher than in the balanced market scenario.
Yield Management in a Stressed Market
The following chart illustrates the impact of yield management in a “stressed market.” A stressed market is defined as a market where supply exceeds demand, and competition for the most desirable segments is significant. These market conditions may arise from increases in supply, decreases in demand, or a combination of both factors. Again, our example assumes that the goal is to maintain the same occupancy rate under the stressed market conditions as in the balanced market.
 Source: HVS
In a stressed market, the competition to attract demand from the retail segment is particularly strong and, as a result, a hotel typically cannot maintain the level of retail demand achieved in a balanced market. Given the mandate of maintaining occupancy levels, the lost retail demand must be replaced with demand from other segments. This dynamic frequently occurs in markets that had previously experienced peak periods of lodging activity, when demand exceeded supply, and hoteliers could be confident of selling a large proportion of their inventory at retail rates. As the number and certainty of these “compression” periods diminishes, hotels must allocate a greater proportion of the inventory to the lower-rated segments. This strategy ensures the scarcity that is necessary to achieve premium rates as the peak demand period approaches, but necessarily reduces the number of rooms available for sale at these premium rates. The shift to a greater dependence on the lower-rated segments results in a 2.0% decrease in the property’s overall rate. In highly stressed (competitive) markets, pricing is often also under pressure, as some competitors will use price as a marketing tool to attract demand. When a 2.0% price decrease is added to the equation, the stressed market scenario loses another $2.70, resulting in an ADR decline of 3.9% as compared to balanced market conditions.
Interpreting Market Data
Understanding the defensive role of yield management can aid in interpreting how a market is holding up under changing market conditions affecting either supply or demand. In the case of a market that is experiencing significant increases in demand, ADRs will typically increase as well, as the scarcity of inventory, particularly in peak demand periods, supports both a shift in segmentation and price increases. In these circumstances, the pace of ADR growth will often exceed inflation.
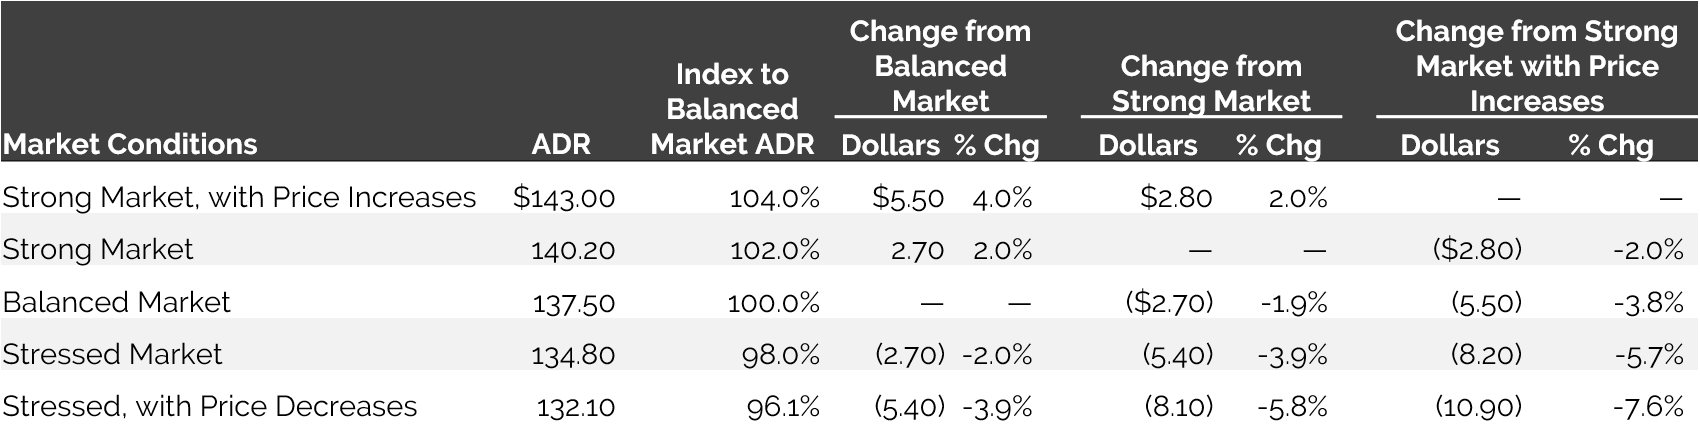
Conversely, as a market encounters increases in supply without concurrent, proportionate increases in demand, or experiences a decline in demand, the pace of ADR growth will slow. In these conditions, there is less opportunity to maximize ADRs, and the need to accept a higher proportion of lower rated demand increases. If the shift is significant enough, ADRs may actually decline, particularly if prices are lowered as well. The following chart illustrates the changes in ADR that could result from shifting market conditions, using the data from the previously presented examples.
 Source: HVS
In the above example, a balanced market that comes under competitive pressure experiences a 2.0% decrease in ADR; this increases to 3.9% if the competitive pressures are sufficient to induce price decreases. If the market had been strong, the decreases would have been greater, reaching as high as a 5.8% decline inclusive of price cuts. And for those markets that experience a severe change in market dynamics, the change from the ADR achieved by a strong market with price increases to a stressed market with price decreases is -7.6%.
A Historical Example
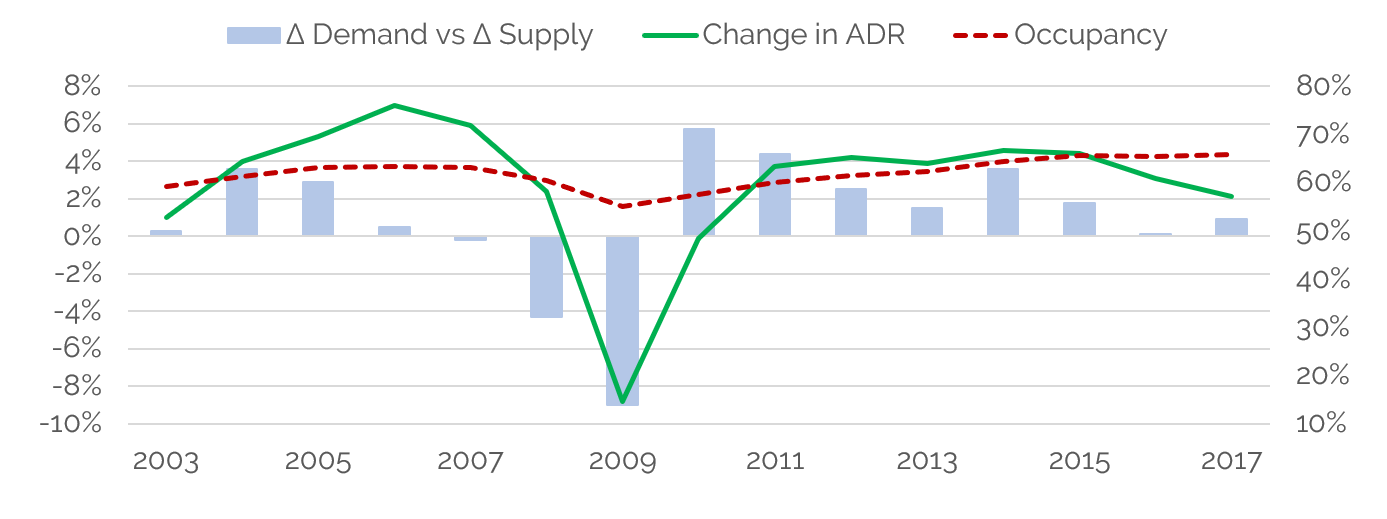
The above example can be helpful in interpreting real market data. For example, the significant decline in ADR that most lodging markets experienced in the recent recession was a direct result of the shift from a strong market with price increases to a stressed market with price decreases. These dynamics are illustrated in the following chart. The bars indicate the difference between the change in supply and the change in demand. A positive value indicates that demand growth was greater than supply growth in a given year, and a negative value indicates that supply growth outpaced demand growth.
U.S. Lodging Market
 Source: STR
From 2003 through 2006, demand growth exceeded supply growth, and occupancy levels were relatively stable. These market conditions mirror the strong market conditions posited in the above example. Consistent with the example, ADR growth accelerated over this period, peaking at over 6.0% in 2006 as the strong market conditions supported price increases in addition to favorable market segmentation shifts. With the onset of the recession, demand levels dropped substantially, and supply growth outpaced demand growth in both 2008 and 2009. The pace of ADR growth slowed significantly in 2008, and in 2009, ADRs declined by almost 9.0%, as the market responded to the stressed market conditions by cutting prices and increasing the proportion of OTA demand accommodated. As demand recovered in 2010 and 2011, ADR growth resumed, strengthening as the pace of demand growth continued to exceed supply growth and as hotels were able to decrease dependence on lower-rated segments, as well as implement some price increases. Most recently, the market has moved toward balanced conditions, and the pace of ADR growth has slowed.
Looking for Clues
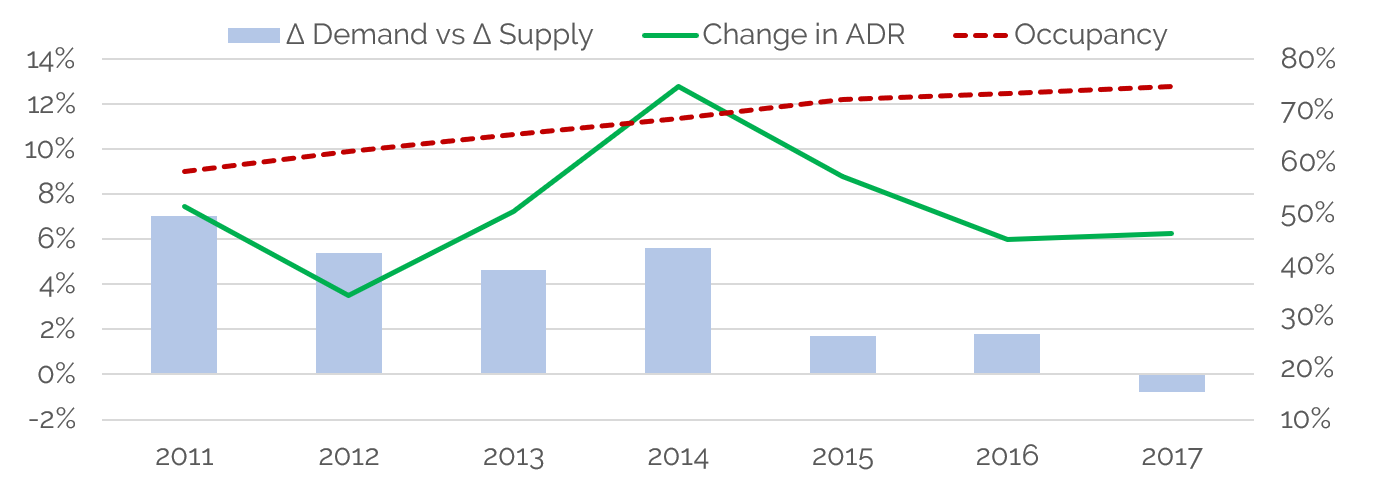
An understanding of these market dynamics can aid in the interpretation of current trends. The following chart shows the same supply/demand, ADR, and occupancy data for the Nashville metropolitan market, which comprises over 40,000 rooms.
Metro Nashville Lodging Market
 Source: STR
Beginning in 2011, demand growth outpaced supply increases in Nashville by over 4.0%, a significant margin by any standard. This imbalance between demand and supply supported strong ADR growth, driven by yield-management-orchestrated market segmentation shifts and substantial price increases. As the rate of new supply growth accelerated in 2015 and 2016, demand continued to outpace supply, but by a diminishing margin, and in 2017, supply growth outpaced demand. This shift toward a balanced market resulted in a decline in the degree of ADR growth since the peak 8.8% recorded in 2015. However, the 6.0% ADR increases achieved in both 2016 and 2017 indicate that the market is still able to effectively yield manage during many periods of the year while also continuing to implement price increases. These patterns suggest that the market has sufficient depth to absorb additional new supply, although ADR growth may continue to slow further.
Some “Real World” Notes
The examples given above are simplistic; in reality the revenue management task is far more complex, with many more demand sources and rate categories to be considered in both the transient and group segments. The assumed mandate to maintain the occupancy level is also flawed, in that most hoteliers will choose to give up some occupancy to protect ADRs, particularly when occupancy levels are above the mid-70% range. Nevertheless, the market dynamics illustrated in the above examples are factors in virtually all markets (and well-managed hotels), and the resulting shifts in the pace and degree of ADR growth can provide insights into the strength and depth of a market.
We must also note that the above examples assume constant dollars, without inflation. In reality, market conditions change over time, and inflation would be a factor. Thus, the calculated increases or decreases in ADR would also be affected by inflation, making the potential upside of a strong market greater, and mitigating the downside impact of a stressed market. In addition, except in cases of extreme shifts in demand, changes in ADR will lag somewhat behind changes in supply-and-demand dynamics, primarily due to the timing of booking versus the actual use of rooms.
Finally, we note that all markets are subject to numerous forces that affect supply, demand, and hotel use. While the above dynamics are factors for most properties, it is important to also understand the specific circumstances affecting any individual market or submarket.