

WASHINGTON, DC (June 20, 2024) – AAA projects 70.9 million travelers will head 50 miles or more from home over the Independence Day holiday travel period*. For the first time, AAA looked at the entire July 4th week, plus the Saturday before and the Sunday after the holiday. This year’s projected number of travelers for that time period is a 5% increase compared to 2023 and an 8% increase over 2019.
“With summer vacations in full swing and the flexibility of remote work, more Americans are taking extended trips around Independence Day,” said Paula Twidale, Senior Vice President of AAA Travel. “We anticipate this July 4th week will be the busiest ever with an additional 5.7 million people traveling compared to 2019.”
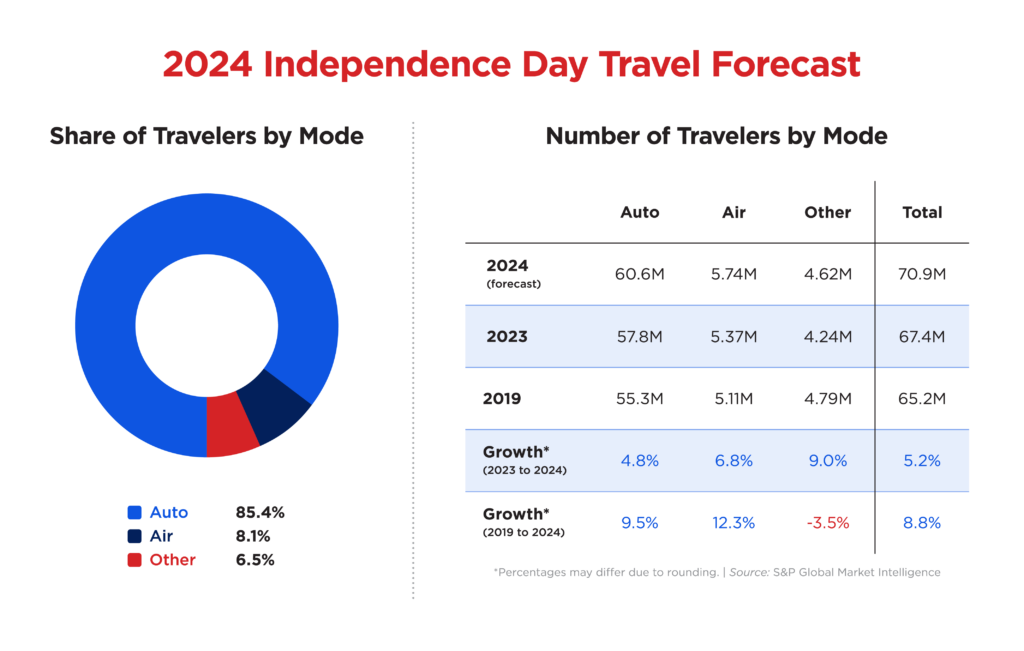
AAA projects a record 60.6 million people will travel by car over Independence Day week – that’s an additional 2.8 million travelers compared to last year. This year’s number also surpasses 2019 when 55.3 million people traveled by car over July 4th week. AAA car rental partner Hertz says Dallas, Denver, Salt Lake City, Los Angeles, and San Francisco are the cities displaying the highest rental demand during the holiday week. The busiest pick-up days are projected to be Friday, June 28, Saturday, June 29, and Wednesday, July 3.
Gas prices are lower than last year when the national average was $3.53. Pump prices will likely continue going down leading up to Independence Day. At that point, they will likely level off and remain relatively stable until after Labor Day, similar to last year. An important caveat is hurricane season – underway now – which could affect gas prices should a storm negatively impact Gulf Coast oil production and refining centers.
The number of air travelers is also expected to set a new record. AAA projects 5.74 million people will fly to their July 4th destinations. That’s an increase of nearly 7% compared to last year and a 12% increase over 2019. AAA booking data shows domestic airfare is 2% cheaper this Independence Day week compared to last year, and the average price for a domestic roundtrip ticket is $800. Airports will be packed throughout the week. AAA recommends arriving 2 hours early, reserving parking ahead of time, and traveling with carry-on luggage versus checked bags to save time and money.
More than 4.6 million people are expected to travel by other modes of transportation, including buses, cruises, and trains. This category is seeing an increase of 9% compared to last year, but this year’s number is shy of 2019’s figure of 4.79 million. Cruising continues its remarkable post-pandemic comeback. This time of year, Alaska cruises are in high demand, making Seattle and Anchorage top domestic destinations. Cruise travelers are also finding deals this summer. With new ships coming onto the market – and going for a premium – some cruise lines have been offering targeted discounts to fill older inventory for remaining cabins.
Best/Worst Times to Drive and Peak Congestion by Metro
INRIX, a provider of transportation data and insights, says the worst times to travel by car before and on July 4th are between 2pm and 7pm. Drivers should hit the road in the morning, and travelers returning on Monday, July 8th should avoid rush hour traffic in the morning and afternoon.
“Drivers in large metro areas can expect the worst traffic delays on Wednesday, July 3rd, as they leave town, and Sunday, July 7th, as they return,” said Bob Pishue, transportation analyst at INRIX. “Road trips over the holiday week could take up to 67% longer than normal. Travelers should monitor 511 services, local news stations, and traffic apps for up-to-the-minute road conditions.”
Please note that the times listed below are for the time zone in which the metro is located.
For example, Atlanta routes = ET and Los Angeles routes = PT.
| Best and Worst Times to Travel by Car | ||
| Date | Worst Travel Time | Best Travel Time |
| Monday, Jul 1 | Minimal Traffic Impact Expected | |
| Tuesday, Jul 2 | 2:00 – 6:00 PM | After 7:00 PM |
| Wednesday, Jul 3 | 2:00 – 7:00 PM | Before Noon |
| Thursday, Jul 4 | 2:00 – 7:00 PM | Before Noon |
| Friday, Jul 5 | 11:00 AM – 4:00 PM | Before 10:00 AM |
| Saturday, Jul 6 | 10:30 AM – 2:30 PM | Before 10:00 AM |
| Sunday, Jul 7 | 2:00 – 8:00 PM | Before 11:00 AM |
| Monday, Jul 8 | 1:00 – 5:00 PM | After 7:00 PM |
Source: INRIX
| Peak Congestion by Metro | ||||
| Metro | Route | Peak Congestion Period | Est. Travel Time | Increase
Compared to Typical |
| Atlanta | Birmingham to Atlanta via I-20 E | Sunday 7th
6:30 PM |
3 hours 36 minutes | 42% |
| Boston | Boston to Hyannis via Pilgrim Hwy S | Thursday 4th
1:45 PM |
1 hour 51 minutes | 31% |
| Chicago | Chicago to Indianapolis via I-65 S | Wednesday 3rd
2:45 PM |
4 hours 59 minutes | 61% |
| Denver | Fort Collins to Denver via I-25 S | Monday 8th
7:30 AM |
1 hour 37 minutes | 56% |
| Detroit | Toronto to Detroit via I-94 W | Monday 8th
3:30 PM |
5 hours 35 minutes | 29% |
| Houston | San Antonio to Houston via I-10 E | Saturday 6th
1:30 PM |
3 hours 48 minutes | 41% |
| Los Angeles | Bakersfield to Los Angeles via I-5 S | Monday 8th
2:15 PM |
1 hour 47 minutes | 29% |
| Minneapolis | Eau Claire to Minneapolis via I-94 W | Monday 8th
4:45 PM |
1 hour 43 minutes | 31% |
| New York | Jersey Shore to New York via Garden State Pkwy N | Sunday 7th
2:15 PM |
1 hour 25 minutes | 40% |
| Philadelphia | Poconos to Philadelphia via PA Turnpike | Monday 8th
8:30 AM |
3 hours 17 minutes | 50% |
| Portland | Portland to Eugene via I-5 S | Wednesday 3rd
5:00 PM |
2 hours 20 minutes | 35% |
| San Diego | San Diego to Palm Springs via I-15 N | Thursday 4th
6:00 PM |
2 hours 55 minutes | 16% |
| San Francisco | San Francisco to Monterey via Santa Cruz Hwy S | Tuesday 2nd
5:45 PM |
2 hours 31 minutes | 19% |
| Seattle | Ellensburg to Seattle via I-90 E | Sunday 7th
4:30 PM |
2 hours 19 minutes | 35% |
| Tampa | Tampa to Orlando via I-4 E | Wednesday 3rd
10:15 AM |
1 hour 54 minutes | 58% |
| Washington DC | Baltimore to Washington DC via Balt/Wash Pkwy S | Monday 8th
3:15 PM |
1 hour 1 minute | 67% |
Source: INRIX
Top Destinations
This July 4th week, travelers are cooling off in the Pacific Northwest and Alaska – and by the ocean! Seattle, Vancouver, and Anchorage are top destinations because of the popularity of Alaska cruises this time of year. Beaches in South Florida, Honolulu, Punta Cana, and Barcelona are in high demand. Historical sites in European cities like London, Rome, Dublin, Paris, and Athens are also popular. The top 10 domestic and international destinations below are based on AAA booking data.
| DOMESTIC | INTERNATIONAL |
| Seattle, WA | Vancouver, BC, Canada |
| Orlando, FL | London, England |
| Anchorage, AK | Rome, Italy |
| Honolulu, HI | Dublin, Ireland |
| Miami, FL | Paris, France |
| New York, NY | Calgary, AB, Canada |
| Fort Lauderdale, FL | Amsterdam, Netherlands |
| Las Vegas, NV | Punta Cana, Dominican Republic |
| Denver, CO | Athens, Greece |
| Anaheim/Los Angeles, CA | Barcelona, Spain |
Holiday Forecast Methodology
Travel Forecast
In cooperation with AAA, S&P Global Market Intelligence (SPGMI) developed a unique methodology to forecast actual domestic travel volumes. The economic variables used to forecast travel for the current holiday are leveraged from SPGMI’s proprietary databases. These data include macroeconomic drivers such as employment, output, household net worth, asset prices, including stock indices, interest rates, housing market indicators, and variables related to travel and tourism, including gasoline prices, airline travel, and hotel stays. AAA and SPGMI have quantified holiday travel volumes going back to 2000.
Historical travel volume estimates come from DK SHIFFLET’s TRAVEL PERFORMANCE/MonitorSM. The PERFORMANCE/MonitorSM is a comprehensive study measuring the travel behavior of U.S. residents. DK SHIFFLET contacts over 50,000 U.S. households each month to obtain detailed travel data, resulting in the unique ability to estimate visitor volume and spending, identify trends, and forecast U.S. travel behavior, all after the trips have been taken.
The travel forecast is reported in person-trips. In particular, AAA and SPGMI forecast the total U.S. holiday travel volume and expected mode of transportation. The travel forecast presented in this report was prepared the week of May 27, 2024.
Because AAA forecasts focus on domestic leisure travel only, comparisons to TSA passenger screening numbers should not be made. TSA data includes all passengers traveling on both domestic and international routes. Additionally, TSA screens passengers each time they enter secured areas of the airport, therefore each one-way trip is counted as a passenger tally. AAA focuses on person-trips, which include the full round-trip travel itinerary. As a result, direct comparisons of AAA forecast volumes and daily TSA screenings represent different factors.
*Independence Day Holiday Travel Period
For this forecast, the Independence Day holiday travel period is defined as the nine-day period from Saturday, June 29 to Sunday, July 7. Historically, the Independence Day holiday period included only one weekend. This is the first year the Independence Day holiday travel period is a longer timeframe with two weekends included.